#OPINIONLEADER#

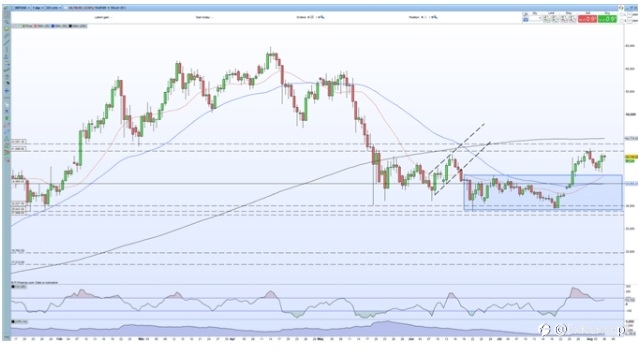
Bitcoin Daily Price Chart (January – August 6, 2021)
 The cryptocurrency market is a sea of green going into the weekend with Bitcoin nearing $41k, Ethereum eyeing $2.8k, and a raft of alt-coins showing high single-digit gains today. The small sell-off early in the week has been reversed and the market outlook remains positive, despite the proposed cryptocurrency proposals currently being debated in the US Infrastructure Bill. The latest proposal would see Proof-of-Work projects exempt from customer tax reporting, while the DeFi sector would be liable for onerous tax reporting obligations. Much can change over the weekend, but as we stand the market continues to push ahead regardless.
Bitcoin is again probing a cluster of prior highs all the way back up to the $43.5k level after springing off prior resistance/now support around $37k. The 20-day simple moving average has pushed above the 50-dsma, highlighting the current bout of positive sentiment, while BTC is no longer in overbought territory.
Disclaimer: The content above represents only the views of the author or guest. It does not represent any views or positions of FOLLOWME and does not mean that FOLLOWME agrees with its statement or description, nor does it constitute any investment advice. For all actions taken by visitors based on information provided by the FOLLOWME community, the community does not assume any form of liability unless otherwise expressly promised in writing.
FOLLOWME Trading Community Website: https://www.followme.com


Hot
No comment on record. Start new comment.