China A50 - Get The Full Picture

WEEKLY CHART FROM 2013
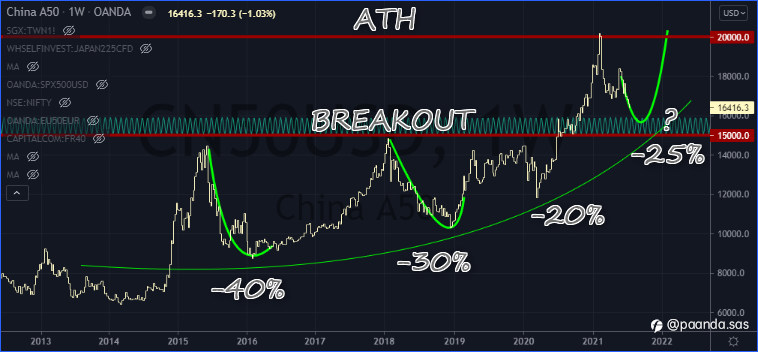
As you may see, patience and position sizing is key, as this Chinese index usually takes an average 1 year and 30 to 40% retracement before getting some juice again.
*Please, note that % are approximative for illustration (we don't fight for 2-3%), and are based on close price of the week. In practice, the drawdown between the very high and the very low can be higher than 50%.
We can observe:
- the speed of the slope increases slightly over the time = gaining strength
- the market still doesn't benefit from full liquidity = high volatility
- a full retracement averages (1y) + (30% drawdown)
- 15K (+-) seems to be a major turning point
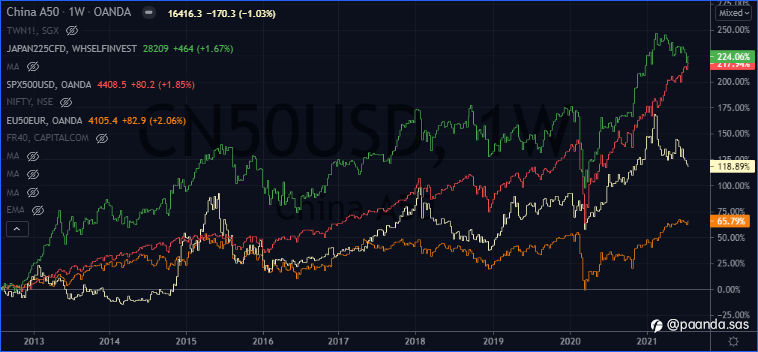
COMPARED TO OTHER INDICES
YEAR TO DATE PERFORMANCE
The market performance YTD: -7.5%
The market performance from ATH: -20%
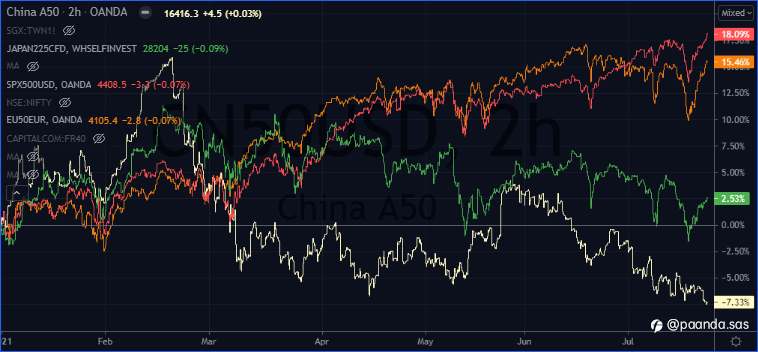
After a fantastic 2020, in 2021 so far the China A50 Index clearly underperforms its partners. This, due to several factors that are out of the main topic of this post, and that we consider only short-term events/ impacts. Noise, so to say. As you can see, performance is pretty much mixed.
TAIWAN - PERIPHERICAL PERFORMANCE
Very interested in Taiwan as well, giving superb energy since it is listed. However, we smell like something could happen there (China/US) - hope not too bad - sooner than later and could give an opportunity to enter at a better price in these stocks.
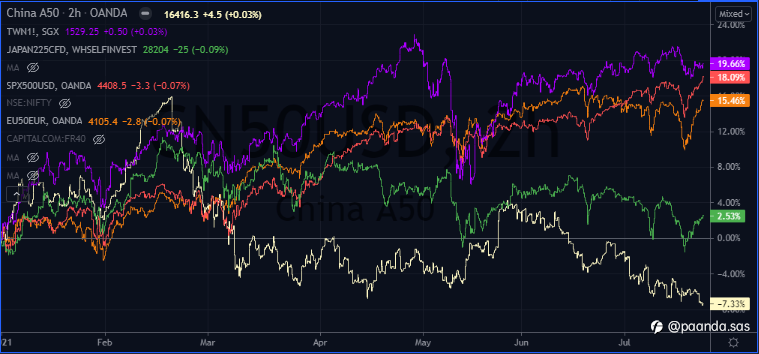
We will not write about Taiwan as we might be not fully objective - I love 林口 so much :) But it might be a very interesting idea to include it as a peripheric, in an "Asia oriented" portfolio.
SO... WHAT ABOUT CHINA RIGHT NOW?
Trading consistently below its weekly average price from the last peak (18K) in May
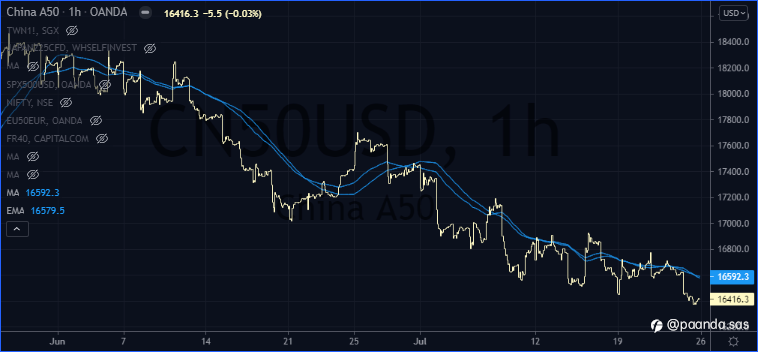
Remains neutral during the last 2 weeks trading activity
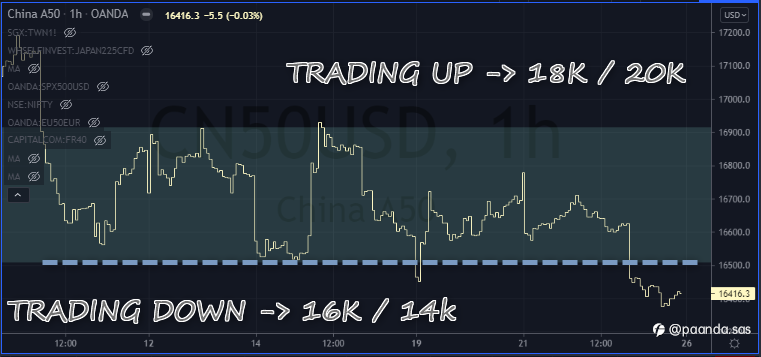
CONCLUSION
The market is:
- volatile
- bullish in the long term
- bearish in the short term
- The optimal price seems to be 14K<>16K
Hence, we need to:
- manage risk and exposure accordingly
- be patient
NOTE FROM THE DESK
In order to add to our current exposure, we remain in the wait, either for:
- a better price (in the 14K<>16K area)
- a better momentum (trading > weekly avg.)
Future will tell...
We encourage you to read our relevant articles on the topic
CHINA A50 - CONSOLIDATION TIME
PAANDA SMALL - Q2 STRATEGIC REPORT
Edited 25 Jul 2021, 03:01
Disclaimer: The content above represents only the views of the author or guest. It does not represent any views or positions of FOLLOWME and does not mean that FOLLOWME agrees with its statement or description, nor does it constitute any investment advice. For all actions taken by visitors based on information provided by the FOLLOWME community, the community does not assume any form of liability unless otherwise expressly promised in writing.
FOLLOWME Trading Community Website: https://www.followme.com


Hot
-THE END-