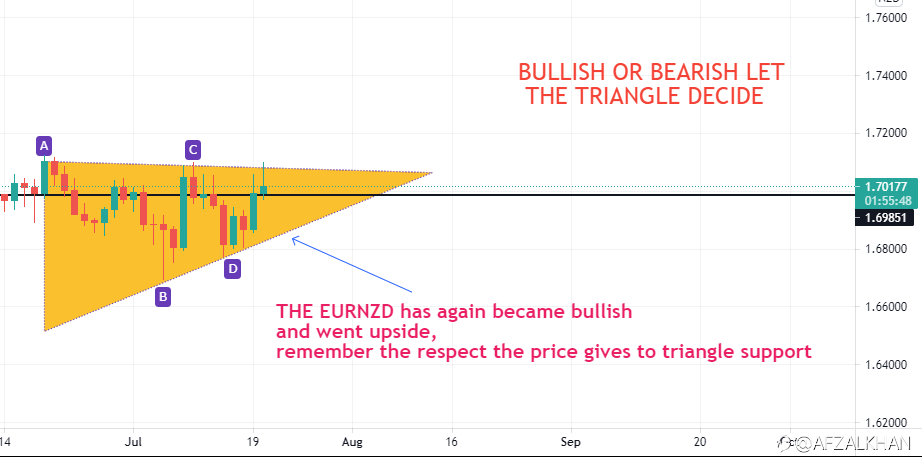
The EURNZD Triangle pattern has shown a AC line resistance hit , but pull down downwards.
Guys , we all have been witnessing the game play of EURUSD in triangle pattern and we can observe that the price did actually hit the AC resistance line and a pull down came. The respect i always talks about the price have for resistance or support zone is tremendous. The price tends to pull down when ever it hits the AC resistance line. We can clearly see this in the chart. I suggests to wait and capture the move with AC and BD lines.The triangle needs to be broken in order to receive a proper bull or bear direction. Till then observe the chart and take advanage of AC and BD lines on daily basis.Untill it breaks the triangle zone.
#OPINIONLEADER##OPINIONLEADERINDONESIA##FX##StockMarket##investment##EUR/NZD#
Disclaimer: The content above represents only the views of the author or guest. It does not represent any views or positions of FOLLOWME and does not mean that FOLLOWME agrees with its statement or description, nor does it constitute any investment advice. For all actions taken by visitors based on information provided by the FOLLOWME community, the community does not assume any form of liability unless otherwise expressly promised in writing.
FOLLOWME Trading Community Website: https://www.followme.com


Hot
No comment on record. Start new comment.