How to Measure Volatility

How to Measure Volatility
Volatility is something that we can use when looking for good breakout trade opportunities.
Volatility measures the overall price fluctuations over a certain time and this information can be used to detect potential breakouts.
There are a few indicators that can help you gauge a pair’s current volatility.
Using these indicators can help you tremendously when looking for breakout opportunities.
1. Moving Average
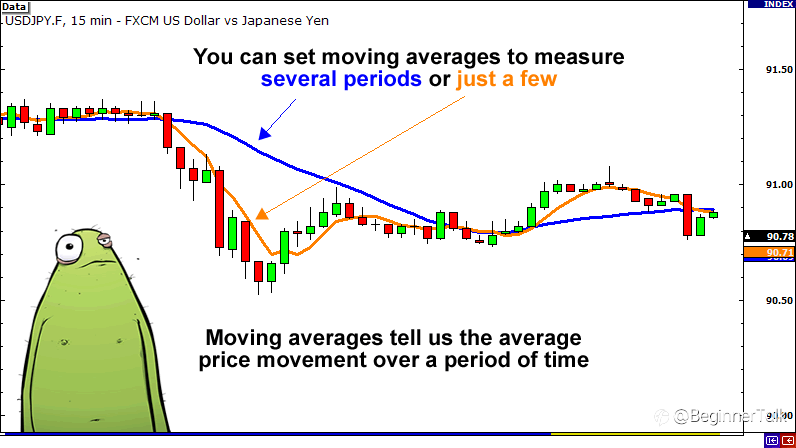
Moving averages are probably the most common indicator used by forex traders and although it is a simple tool, it provides invaluable data.
Simply put, moving averages measures the average movement of the market for an X amount of time, where X is whatever you want it to be.
For example, if you applied a 20 SMA to a daily chart, it would show you the average movement for the past 20 days.
There are other types of moving averages such as exponential and weighted, but for the purpose of this lesson, we won’t go too much into detail on them.
For more information on moving averages or if you just need to refresh yourself on them, check out our lesson on moving averages.
2. Bollinger Bands
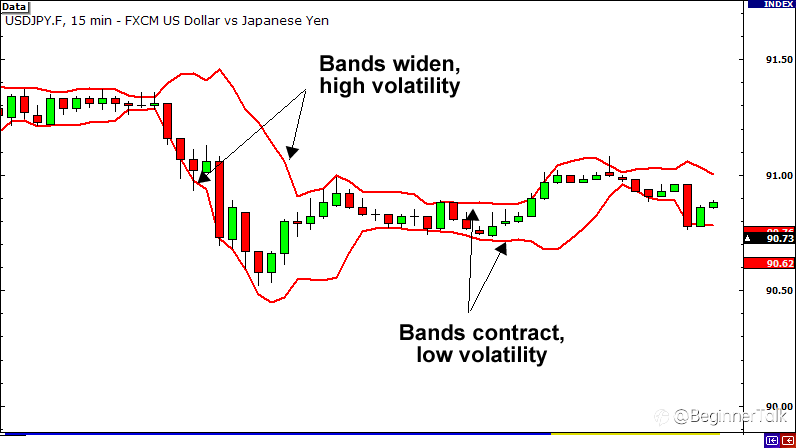
Bollinger Bands are excellent tools for measuring volatility because that is exactly what it was designed to do.
Bollinger Bands are basically 2 lines that are plotted 2 standard deviations above and below a moving average for an X amount of time, where X is whatever you want it to be.
So if we set it at 20, we would have a 20 SMA and two other lines.
One line would be plotted +2 standard deviations above it and the other line would be plotted -2 standard deviations below.
When the bands contract, it tells us that volatility is LOW.
When the bands widen, it tells us that volatility is HIGH.
For a more thorough explanation, check out our Bollinger Bands lesson.
3. Average True Range (ATR)
Last on the list is the Average True Range, also known as ATR.
The ATR is an excellent tool for measuring volatility because it tells us the average trading range of the market for X amount of time, where X is whatever you want it to be.
Basically, ATR takes the currency pair’s range, which is the distance between the high and low in the time frame under study, and then plots that measurement as a moving average
So if you set ATR to “20” on a daily chart, it would show you the average trading range for the past 20 days.
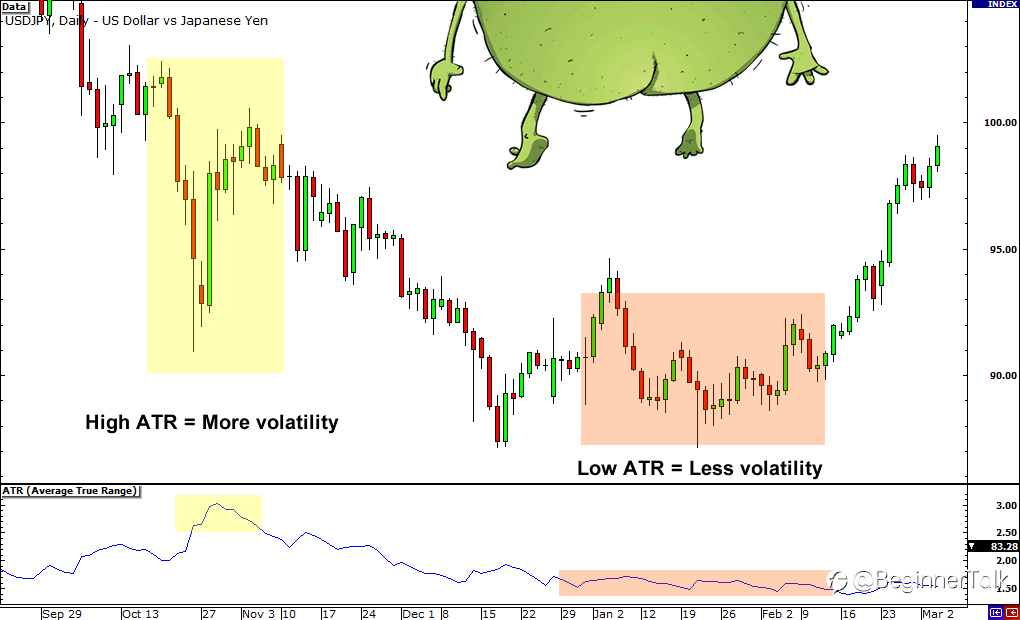
When ATR is falling, it is an indication that volatility is decreasing.
When ATR is rising, it is an indication that volatility has been on the rise.
Just remember that that ATR is a volatility indicator, NOT a directional indicator.
It’s s best used as a technical indicator to help confirm the market’s enthusiasm (or lack of) for range breakouts.
To learn more about ATR, check out our Forepedia page on ATR.
Reprinted from Babypips,the copyright all reserved by the original author.
Disclaimer: The content above represents only the views of the author or guest. It does not represent any views or positions of FOLLOWME and does not mean that FOLLOWME agrees with its statement or description, nor does it constitute any investment advice. For all actions taken by visitors based on information provided by the FOLLOWME community, the community does not assume any form of liability unless otherwise expressly promised in writing.
FOLLOWME Trading Community Website: https://www.followme.com


Hot
No comment on record. Start new comment.