How to use Pivot Points to Trade Breakouts

Just like your normal support and resistance levels, pivot point levels won’t hold forever.
Using pivot points for range trading will work, but not all the time. In those times that these levels fail to hold, you should have some tools ready in your forex toolbox to take advantage of the situation!
s we showed you earlier, there are two main ways to trade breakouts: the aggressive way or the safe way.
Either method will work just fine. Just always remember that if you take the safe way, which means waiting for a retest of support or resistance, you may miss out on the initial move.
Using Pivot Points to Trade Potential Breakouts
Let’s take a look at a chart to see potential breakout trades using pivot points. Below is a 15-minute chart of EUR/USD.
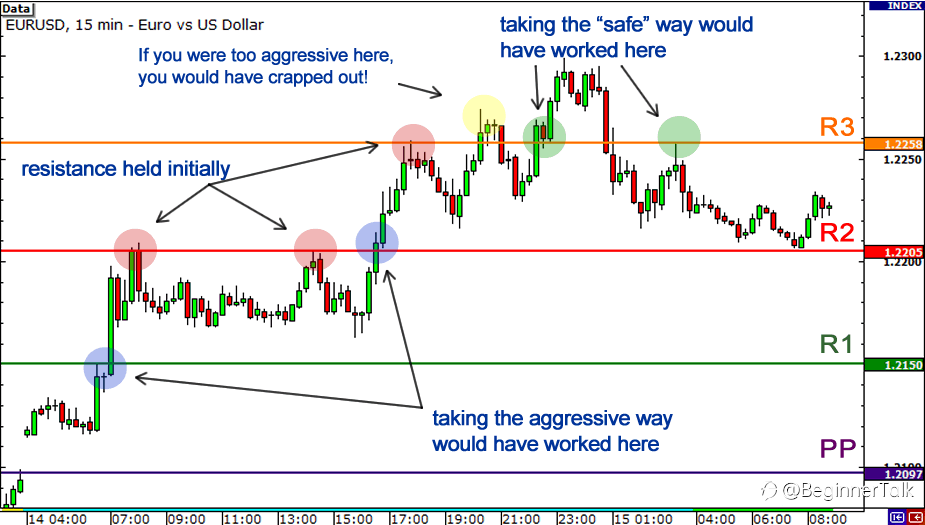
Here we see EUR/USD made a strong rally throughout the day.
We see that EUR/USD opened by gapping up above the pivot point. Price made a strong move up, before pausing slightly at R1.
Eventually, resistance broke and the pair jumped up by 50 pips!
If you had taken the aggressive method, you would have caught the initial move and been celebrating like you just won the World Cup.
On the other hand, if you had taken the safe way and waited for a retest, you would have been one sad little trader. The price did not retest after breaking R1. In fact, the same thing happened for both R1 and R2!
Notice how EUR/USD bulls tried to make a run for R3 as well.
However, if you had taken the aggressive method, you would have gotten caught up in a fakeout as the price failed to sustain the initial break. If your stop was too tight, then you would have gotten stopped out.
Later on though, you’ll see that the price eventually broke through. Notice how there was also a retest of the broken resistance line.
Also, observe how when the pair reversed later in the day and broke down past R3. There was an opportunity to take a short on the retest of resistance-turned-support-turned resistance (read that again if you have to!).
“Role Reversal”
Remember that, when support levels break, they usually turn into resistance levels.
This concept of “role reversal” also applies to broken resistance levels which become support levels. These would have been good opportunities to take the “I think I’ll play it safe” method.
Where do you place stops and pick targets with breakouts?
One of the difficult things about taking breakout trades is picking a spot to place your stop.
Unlike range trading where you are looking for breaks of pivot point support and resistance levels, you are looking for strong fast moves.
Once a level breaks, in theory, that level will likely become “support-turned-resistance” or “resistance-turned-support.” Again, this is called a role reversal…since the roles have been reversed.
If you were going long and the price broke R1, you could place your stop just below R1.
Let’s go back to that EUR/USD chart to see where you could place your stops.
As for setting targets, you would typically aim for the next pivot point support or resistance level as your take profit point.
It’s very rare that price will break past all the pivot point levels unless a big economic event or surprise news comes out.
Let’s go back to that EUR/USD chart to see where you would put those stops and take profit.
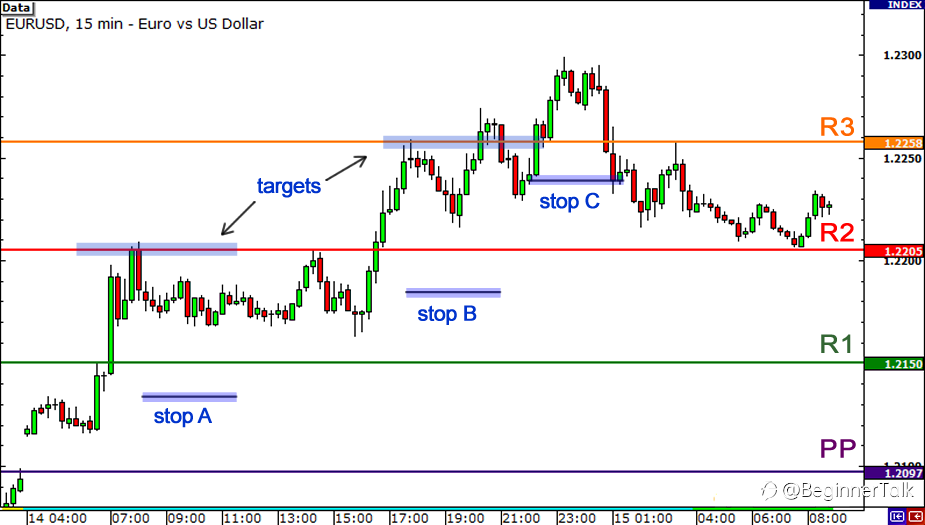
In this example, once you saw price break R1, you would have set your stop just below R1.
If you believed that the price would continue to rise, you could keep your position and move your stop manually to see if the move would continue.
You’d have to watch carefully and adjust accordingly. You’ll learn more about this in later lessons.
As with any method or indicator, you have to be aware of the risks of taking breakout trades.
First of all, you have no idea whether or not the move will continue. You might enter thinking that the price will continue to rise, but instead, you catch a top or bottom, which means that you’ve been faked out!
Second, you won’t be sure if it’s a true breakout or just wild moves caused by the release of important news.
Spikes in volatility are a common occurrence during news events, so be sure to keep up with breaking news and be aware of what’s on the economic calendar for the day or week.
Lastly, just like in range trading, it would be best to pop on other key support and resistance levels.
You might be thinking that R1 is breaking, but you failed to notice a strong resistance level just past R1.
Price may break past R1, test the resistance and just fall back down.
You should make use of your forex knowledge of support and resistance, candlestick patterns, and momentum indicators to help you give stronger signals as to whether the break is for real or not.
Reprinted from Babypips,the copyright all reserved by the original author.
Disclaimer: The content above represents only the views of the author or guest. It does not represent any views or positions of FOLLOWME and does not mean that FOLLOWME agrees with its statement or description, nor does it constitute any investment advice. For all actions taken by visitors based on information provided by the FOLLOWME community, the community does not assume any form of liability unless otherwise expressly promised in writing.
FOLLOWME Trading Community Website: https://www.followme.com


Hot
No comment on record. Start new comment.