How to Use ADX (Average Directional Index)

When trading, it can be helpful to gauge the strength of a trend, regardless of its direction.
And when it comes to evaluating the strength of a trend, the Average Directional Index is a popular technical indicator for this purpose.
The Average Directional Index, or ADX for short, is another example of an oscillator.
ADX fluctuates from 0 to 100, with readings below 20 indicating a weak trend and readings above 50 signaling a strong trend.
The ADX calculation can be complicated, but in a nutshell, the stronger the trend, the higher ADX goes
When the ADX is low, it highlights periods when the price is usually going sideways or trading in a range.
When the ADX has risen above 50, this indicates that the price has picked up momentum in one direction.
Unlike Stochastic, ADX does NOT determine whether the trend is bullish or bearish. Rather, it merely measures the strength of the current trend.
Because of that, ADX is typically used to identify whether the market is ranging or starting a new trend.ADX is considered a “non-directional” indicator. It is based on comparing the highs and lows of bars and does not use the close of the bar.
The stronger the trend, the larger the reading regardless of whether it is an uptrend or downtrend.
How to Use ADX
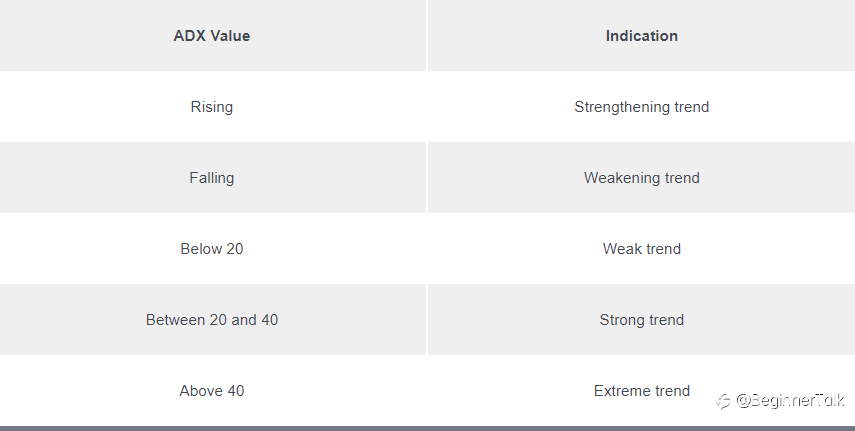
When you’re using the ADX indicator, keep an eye on the 20 and 40 as key levels.
here’s a little cheat sheet to help you interpret ADX values.
Take a look at these neat charts we’ve pulled up:
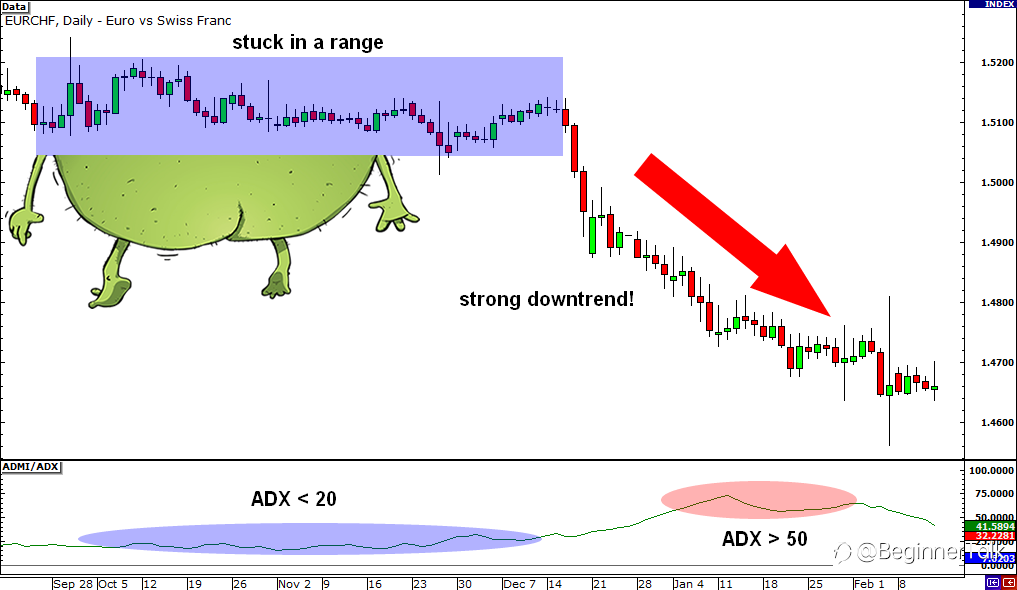
In this first example, ADX lingered below 20 from late September until early December.
As you can see from the chart, EUR/CHF was stuck inside a range during that time.
Beginning in January though, ADX started to climb above 50, signaling that a strong trend could be waiting in the wings.And would you look at that! EUR/CHF broke below the bottom of the range and went on a strong downtrend. Ooh, that’d be around 400 pips in the bag.
Book it, baby!
Now, let’s look at this next example:
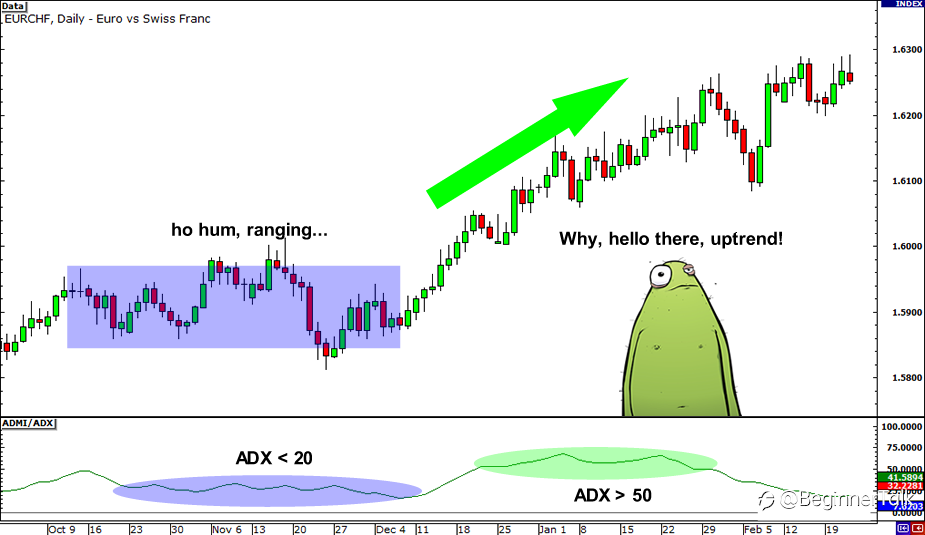
Just like in our first example, ADX hovered below 20 for quite a while. At that time, EUR/CHF was also ranging.
Soon enough, ADX rose above 50 and EUR/CHF broke above the top of its range.
Tada!
A strong uptrend took place. That’d be 300 pips, signed, sealed, and delivered!
Looks simple enough, right?
If there’s one problem with using ADX, it’s that it doesn’t exactly tell you whether it’s a buy or a sell.What it does tell you is whether it’d be okay to jump in an ongoing trend or not.
Once ADX starts dropping below 50 again, it could mean that the uptrend or downtrend is starting to weaken and that it might be a good time to lock in profits.
How to Trade Using ADX
One way to trade using ADX is to wait for breakouts first before deciding to go long or short.
ADX can be used as confirmation whether the pair could possibly continue in its current trend or not.Another way is to combine ADX with another indicator, particularly one that identifies whether the pair is headed downwards or upwards.
ADX can also be used to determine when one should close a trade early.
For instance, when ADX starts to slide below 50, it indicates that the current trend is losing steam.
From then on, the pair could possibly move sideways, so you might want to lock in those pips before that happens.
As the saying goes, “The trend is your friend.”
Until it stabs you in the back.
Oh wait.
I mean…” Until it reverses.”
(Got caught up in memories for a moment there.)
The next time you think a trend is changing and you need to decide whether to stick to this “friend” or cut ties, consider trying the ADX to confirm the trend’s strength.
Reprinted from Babypips,the copyright all reserved by the original author.
Disclaimer: The content above represents only the views of the author or guest. It does not represent any views or positions of FOLLOWME and does not mean that FOLLOWME agrees with its statement or description, nor does it constitute any investment advice. For all actions taken by visitors based on information provided by the FOLLOWME community, the community does not assume any form of liability unless otherwise expressly promised in writing.
FOLLOWME Trading Community Website: https://www.followme.com


Hot
No comment on record. Start new comment.