How to Use RSI (Relative Strength Index)

Relative Strength Index, or RSI, is a popular indicator developed by a technical analyst named J. Welles Wilder, that helps traders evaluate the strength of the current market.
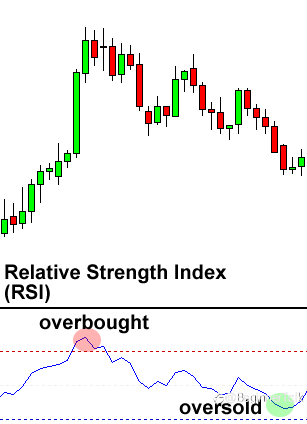
RSI is similar to Stochastic in that it identifies overbought and oversold conditions in the market.
It is also scaled from 0 to 100.Typically, readings of 30 or lower indicate oversold market conditions and an increase in the possibility of price strengthening (going up).
Some traders interpret that an oversold currency pair is an indication that the falling trend is likely to reverse, which means it’s an opportunity to buy.
Readings of 70 or higher indicate overbought conditions and an increase in the possibility of price weakening (going down).
Some traders interpret that an overbought currency pair is an indication that the rising trend is likely to reverse, which means it’s an opportunity to sell.
In addition to the overbought and oversold indicators mentioned above, traders who use the Relative Strength Index (RSI) indicator also look for centerline crossovers.
A movement from below the centerline (50) to above indicates a rising trend.
A rising centerline crossover occurs when the RSI value crosses ABOVE the 50 line on the scale, moving towards the 70 line. This indicates the market trend is increasing in strength, and is seen as a bullish signal until the RSI approaches the 70 line.
A movement from above the centerline (50) to below indicates a falling trend.
A falling centerline crossover occurs when the RSI value crosses BELOW the 50 line on the scale, moving towards the 30 line. This indicates the market trend is weakening in strength, and is seen as a bearish signal until the RSI approaches the 30 line.
How to Trade Using RSI
RSI can be used just like the Stochastic indicator.
We can use it to pick potential tops and bottoms depending on whether the market is overbought or oversold.
Below is a 4-hour chart of EUR/USD.
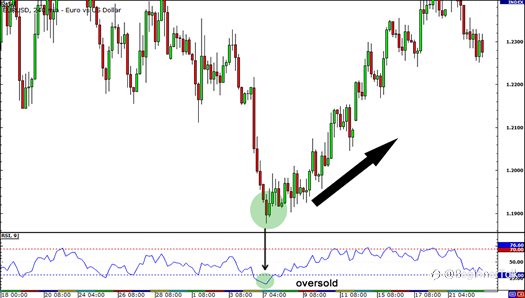
EUR/USD had been dropping the week, falling about 400 pips over the course of two weeks.
On June 7, it was already trading below the 1.2000 handle.However, RSI dropped below 30, signaling that there might be no more sellers left in the market and that the move could be over.
Price then reversed and headed back up over the next couple of weeks.
Determining the Trend using RSI
RSI is a very popular tool because it can also be used to confirm trend formations.If you think a trend is forming, take a quick look at the RSI and look at whether it is above or below 50.
If you are looking at a possible UPTREND, then make sure the RSI is above 50.
If you are looking at a possible DOWNTREND, then make sure the RSI is below 50.
Reprinted from Babypips,the copyright all reserved by the original author.
Disclaimer: The content above represents only the views of the author or guest. It does not represent any views or positions of FOLLOWME and does not mean that FOLLOWME agrees with its statement or description, nor does it constitute any investment advice. For all actions taken by visitors based on information provided by the FOLLOWME community, the community does not assume any form of liability unless otherwise expressly promised in writing.
FOLLOWME Trading Community Website: https://www.followme.com


Hot
No comment on record. Start new comment.