How to Use Bollinger Bands

Congratulations on making it to the 5th grade!
Each time you make it to the next grade you continue to add more and more tools to your trader’s technical analysis (TA) toolbox.
“What’s a trader’s toolbox?” you ask.
Simple!

Let’s compare trading to building a house.
You wouldn’t use a hammer on a screw, right? Nor would you use a buzz saw to drive in nails.
There’s a proper tool for each situation.
Just like in trading, certain technical indicators are best used for particular environments or situations.
So, the more tools you have, the better you can ADAPT to the ever-changing market environment.Or if you want to focus on a few specific trading environments or tools, that’s cool too.
It’s good to have a specialist when installing your electricity or plumbing in a house, just like it’s cool to be a Bollinger Bands or Moving Average specialist.
There are a million different ways to grab some pips!
For this lesson, as you learn about these indicators, think of each as a new tool that you can add to that toolbox of yours.You might not necessarily use all of these tools, but it’s always nice to have plenty of options, right?
You might even find one that you understand and comfortable enough to master on its own. Now, enough about tools already!
Let’s get started!
Bollinger Bands
Bollinger Bands, a technical indicator developed by John Bollinger, are used to measure a market’s volatility and identify “overbought” or “oversold” conditions.

John Bollinger
Basically, this little tool tells us whether the market is quiet or whether the market is LOUD!
When the market is quiet, the bands contract and when the market is LOUD, the bands expand.
Look at the chart below. The Bollinger Bands (BB) is a chart overlay indicator meaning it’s displayed over the price.
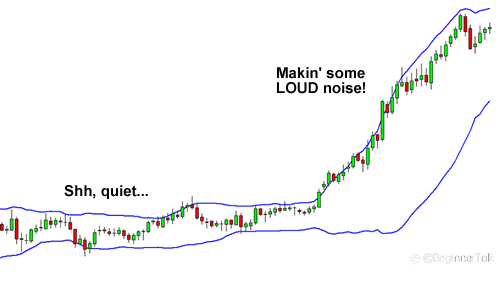
Notice how when the price is quiet, the bands are close together. When the price moves up, the bands spread apart.
The upper and lower bands measure volatility or the degree in the variation of prices over time.
Because Bollinger Bands measure volatility, the bands adjust automatically to changing market conditions.
That’s all there is to it. Yes, we could go on and bore you by going into the history of the Bollinger Bands, how it is calculated, the mathematical formulas behind it, and so on and so forth, but we really didn’t feel like typing it all out.
Okay fine fine, we’ll give a brief description…
What are Bollinger Bands?
Bollinger Bands are typically plotted as three lines:
- An upper band
- A middle line
- A lower band
The middle line of the indicator is a simple moving average (SMA).
Most charting programs default to a 20-period, which is fine for most traders, but you can experiment with different moving average lengths after you get a little experience applying Bollinger Bands.
The upper and lower bands, by default, represent two standard deviations above and below the middle line (moving average).
If you’re freaking out because you’re not familiar with standard deviations.
Have no fear.
The concept of standard deviation (SD) is just a measure of how spread out numbers are.
If the upper and lower bands are 1 standard deviation, this means that about 68% of price moves that have occurred recently are CONTAINED within these bands.
If the upper and lower bands are 2 standard deviations, this means that about 95% of price moves that have occurred recently are CONTAINED within these bands.
You’re probably falling asleep let’s hit you with an image.
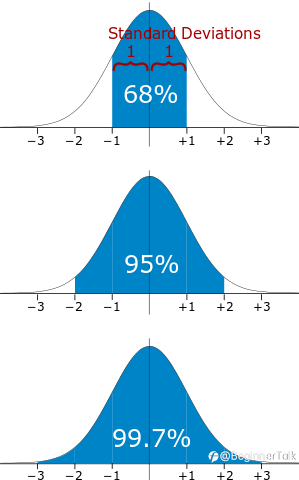
As you can see, the higher the value of SD you use for the bands, the more prices the bands “capture”.
You can try out different standard deviations for the bands once you become more familiar with how they work.
In all honesty, to get started, you don’t need to know most of this stuff. We think it’s more important that we show you some ways you can apply the Bollinger Bands to your trading.
Note: If you really want to learn about the calculations of Bollinger Bands, check out John’s book, Bollinger on Bollinger Bands, or check out our lovely Forexpedia page on Bollinger Bands.
The Bollinger Bounce
One thing you should know about Bollinger Bands is that the price tends to return to the middle of the bands.
That is the whole idea behind the “Bollinger Bounce.”
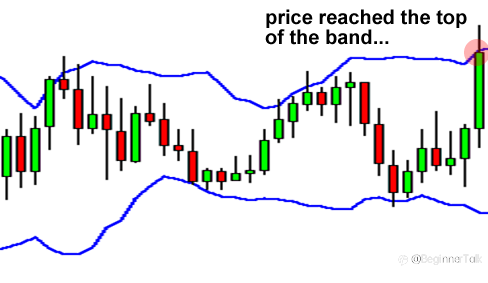
By looking at the chart below, can you tell us where the price might go next?
If you said down, then you are correct! As you can see, the price settled back down towards the middle area of the bands.
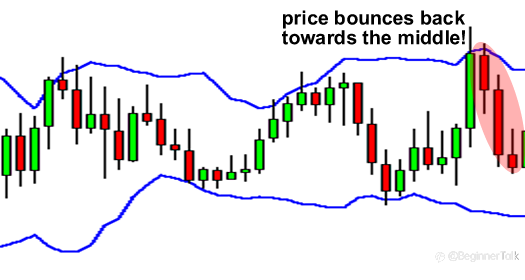
What you just saw was a classic Bollinger Bounce. The reason these bounces occur is that the Bollinger bands act like dynamic support and resistance levels.
The longer the time frame you are in, the stronger these bands tend to be.Many traders have developed systems that thrive on these bounces and this strategy is best used when the market is ranging and there is no clear trend.
You only want to trade this approach when prices trendless. So be mindful of the WIDTH of the bands.
Avoid trading the Bollinger Bounce when the bands are expanding, because this usually means the price is not moving within a range but in a TREND!
Instead, look for these conditions when the bands are stable or even contracting.
Now let’s look at a way to use Bollinger Bands when the market is TRENDING…
Bollinger Squeeze
The “Bollinger Squeeze” is pretty self-explanatory. When the bands squeeze together, it usually means that a breakout is getting ready to happen.
If the candles start to break out above the TOP band, then the move will usually continue to go UP.
If the candles start to break out below the BOTTOM band, then the price will usually continue to go DOWN.
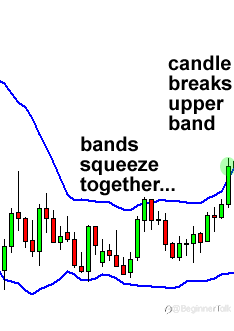
Looking at the chart above, you can see the bands squeezing together. The price has just started to break out of the top band. Based on this information, where do you think the price will go?
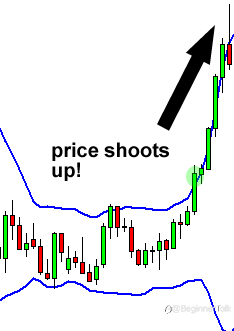
If you said up, you are correct again!
This is how a typical Bollinger Squeeze works.
This strategy is designed for you to catch a move as early as possible.
Setups like these don’t occur every day, but you can probably spot them a few times a week if you are looking at a 15-minute chart.
There are many other things you can do with Bollinger Bands, but these are the two most common strategies associated with them.
Go ahead and add the indicator to your charts and watch how prices move with respect to the three bands. Once you’ve got the hang of it, try changing up some of the indicator’s parameters.
It’s time to put this in your trader’s toolbox before we move on to the next indicator.
Reprinted from Babypips,the copyright all reserved by the original author.
Disclaimer: The content above represents only the views of the author or guest. It does not represent any views or positions of FOLLOWME and does not mean that FOLLOWME agrees with its statement or description, nor does it constitute any investment advice. For all actions taken by visitors based on information provided by the FOLLOWME community, the community does not assume any form of liability unless otherwise expressly promised in writing.
FOLLOWME Trading Community Website: https://www.followme.com


Hot
-THE END-