What Are Moving Averages?

Moving averages are one most commonly used technical indicators.
A moving average is simply a way to smooth out price fluctuations to help you distinguish between typical market “noise” and the actual trend direction.
By “moving average”, we mean that you are taking the average closing price of a currency pair for the last ‘X’ number of periods.
On a chart, it would look like this:
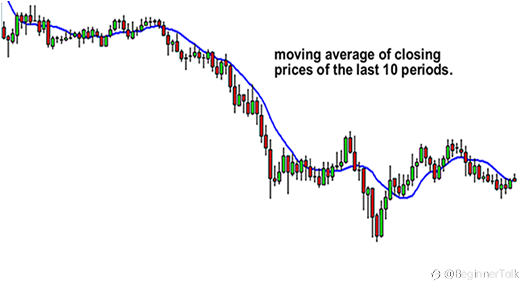
As you can see, the moving average looks like a squiggly line overlayed on top of the price (represented by Japanese candlesticks).
This type of technical indicator is called a “chart overlay“.
The moving average (MA) is overlayed on the price chart! Ya dig? 😎
Like every technical indicator, a moving average (MA) indicator is used to help us forecast future prices.
But why not just look at the price to see what’s happening?
The reason for using a moving average instead of just looking at the price is due to the fact in the real world, aside from Santa Clause not being real…..trends do not move in straight lines.
Price zigs and zags so a moving average helps smooth out the random price movements and help you “see” the underlying trend.

By looking at the slope of the moving average, you can better determine the trend direction.
As we said, moving averages smooth out price action.
There are different types of moving averages and each of them has its own level of “smoothness”.
Generally, the smoother the moving average, the slower it is to react to the price movement.The choppier the moving average, the quicker it is to react to the price movement.
To make a moving average smoother, you should get the average closing prices over a longer time period.
How to Choose the Proper “Length” of a Moving Average
The “length” or the number of reporting periods including the moving average calculation affects how the moving average is displayed on a price chart.
The shorter its “length”, the fewer the data points that are included in the moving average calculation, which means the closer the moving average stays to the current price.
This reduces its usefulness and may offer less insight into the overall trend than the current price itself.
The longer its length, the more data points that are included in the moving average calculation, which means the less any single price can affect the overall average.If there are too many data points, price fluctuations may become “too smooth” that you won’t be able to detect any kind of trend!
Either situation can make it difficult to recognize if price direction may change in the near future.
For this reason, it’s important to select the length (or periods) that provides the level of price detail appropriate for your trading timeframe.
Now, you’re probably thinking, “C’mon, let’s get to the good stuff. How can I use this to trade?”
In this section, we first need to explain to you the two major types of moving averages:
- Simple
- Exponential
We’ll also teach you how to calculate them and give the pros and cons of each. Just like in every other lesson in the BabyPips.com School of Pipsology, you need to know the basics first!
After you’ve got that on lockdown like Argentinian soccer player Lionel Messi’s ball-handling skills, we’ll teach you the different ways to use moving averages and how to incorporate them into your trading strategy.

By the end of this lesson, you’ll be just as smooth as Messi’s!
Before we move on, just remember that moving averages smooth price data to form a trend-following technical indicator.
They do NOT predict price direction; instead, they define the current direction with a lag.
Are you ready?If you are, give us a “Heck yeah!”
If not, go back and reread the intro.
Once you’re pumped and ready to go, head to the next lesson.
Reprinted from Babypips,the copyright all reserved by the original author.
Disclaimer: The content above represents only the views of the author or guest. It does not represent any views or positions of FOLLOWME and does not mean that FOLLOWME agrees with its statement or description, nor does it constitute any investment advice. For all actions taken by visitors based on information provided by the FOLLOWME community, the community does not assume any form of liability unless otherwise expressly promised in writing.
FOLLOWME Trading Community Website: https://www.followme.com


Hot
-THE END-