Fibonacci Retracements are NOT Foolproof

Back in Grade 1, we said that support and resistance levels eventually break.
Well, seeing as how Fibonacci levels are used to find support and resistance levels, this also applies to Fibonacci!
Fibonacci retracements do NOT always work! They are not foolproof.
Let’s go through an example when the Fibonacci retracement tool fails.
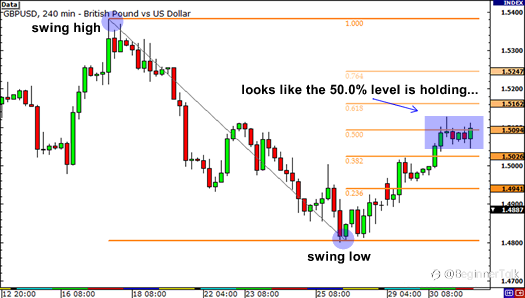
Below is a 4-hour chart of GBP/USD.Here, you see that the pair has been in a downtrend, so you decided to take out your Fibonacci retracement tool to help you spot a good entry point. You use the Swing High at 1.5383, with a swing low at 1.4799.
You see that the pair has been stalling at the 50.0% level for the past couple of candles.
You say to yourself, “Oh man, that 50.0% Fib level! It’s holding baby! Time to short this sucka!”
You short at market and start daydreaming that you’ll be driving down Rodeo Drive in your new Maserati with Scarlett Johansson (or if you’re a lady trader, Ryan Gosling) in the passenger seat…
Now, if you really did put an order at that level, not only would your dreams go up in smoke, but your account would take a serious hit if you didn’t manage your risk properly!
Take a look at what happened.
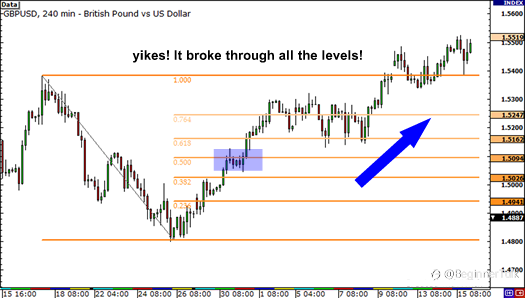
It turns out that that Swing Low was the bottom of the downtrend and the price began to rally above the Swing High point.
What’s the lesson here?
While Fibonacci retracement levels give you a higher probability of success, like other technical tools, they don’t always work. You don’t know if the price will reverse to the 38.2% level before resuming the trend.
Sometimes it may hit 50.0% or the 61.8% levels before turning around. Heck, sometimes the price will just ignore Mr. Fibonacci and blow past all the levels just like how Lebron James bullies his way through the lane with sheer force.
Remember, the market will not always resume its uptrend after finding temporary support or resistance, but instead continue to go past the recent Swing High or Low.Another common problem in using the Fibonacci retracement tool is determining which Swing Low and Swing High to use.
People look at charts differently, look at different time frames, and have their own fundamental biases. It is likely that Stephen from Pipbuktu and the girl from Pipanema have different ideas of where the Swing High and Swing Low points should be.
The bottom line is that there is no absolute right way to do it, especially when the trend on the chart isn’t so clear. Sometimes it becomes a guessing game.
That’s why you need to hone your skills and combine the Fibonacci retracement tool with other tools in your forex toolbox to help give you a higher probability of success.
In the next lesson, we’ll show you how to use the Fibonacci retracement tool in combination with other forms of support and resistance levels, and candlesticks.
Reprinted from Babypips,the copyright all reserved by the original author.
Disclaimer: The content above represents only the views of the author or guest. It does not represent any views or positions of FOLLOWME and does not mean that FOLLOWME agrees with its statement or description, nor does it constitute any investment advice. For all actions taken by visitors based on information provided by the FOLLOWME community, the community does not assume any form of liability unless otherwise expressly promised in writing.
FOLLOWME Trading Community Website: https://www.followme.com


Hot
-THE END-