Is EUR/CAD Set To Recover Further?

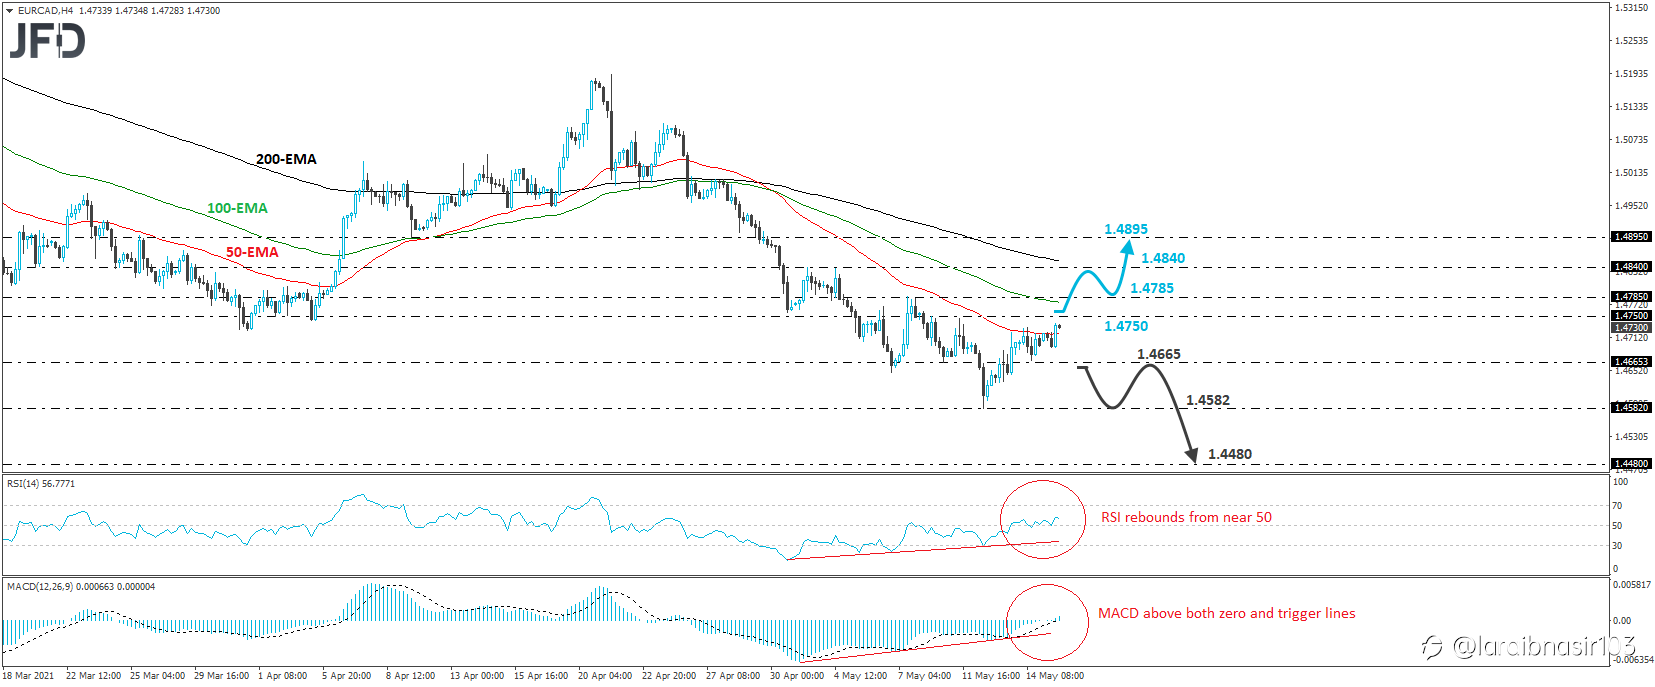
EUR/CAD has been in a recovery mode since last Wednesday, when it hit support at 1.4582. At the time of writing, it looks to be approaching the peak of May 11, at 1.4750, but we would like to see a clear break above that hurdle before we start examining a short-term bullish reversal, and thereby the case of further advances.
A break above that hurdle could quickly bring into play the 1.4785 zone, marked by the high of May 7, the break of which could set the stage for extensions towards the 1.4840 hurdle, which provided resistance on May 3 and 4. If that barrier is not able to stop the bulls either, then we may experience advances towards the inside swing low of Apr. 9, at 1.4895.
Shifting attention to our short-term oscillators, we see that the RSI rebounded again from near its 50 line, while the MACD, already above its trigger line, has just poked its nose above its zero line. What’s more, there is positive divergence between both indicators and the price action. This suggests that the rate may have started picking up positive momentum which increases the chances for the latest recovery to continue for a while more.
Now, in case the bears end up stronger than the bulls, we may see a pullback back below the 1.4665 support, something that may open the path towards the low of last Wednesday, at 1.4582. However, in order to start examining whether the prior downtrend has resumed, we would like to see a clear dip below that obstacle. This would confirm a forthcoming lower low and may encourage declines towards the 1.4480 area, defined as a support by the low of Jan. 29, 2020.
Disclaimer: The content above represents only the views of the author or guest. It does not represent any views or positions of FOLLOWME and does not mean that FOLLOWME agrees with its statement or description, nor does it constitute any investment advice. For all actions taken by visitors based on information provided by the FOLLOWME community, the community does not assume any form of liability unless otherwise expressly promised in writing.
FOLLOWME Trading Community Website: https://www.followme.com


Hot
-THE END-