Daily Market Report - 12th Jan 2021


Official Website: https://www.nooralmal.com/
EURUSD
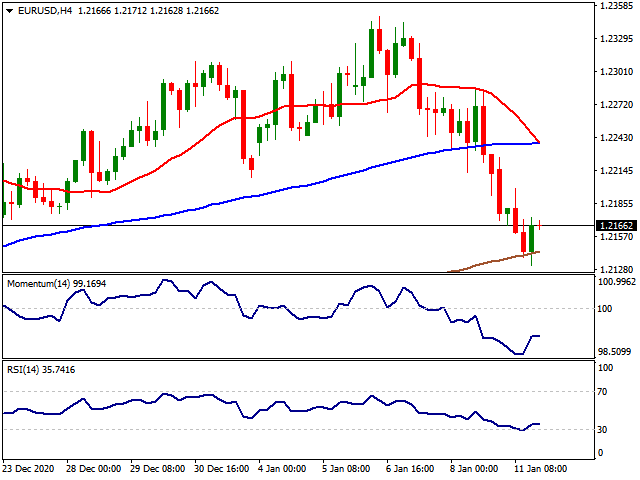
The EUR/USD pair fell on Monday to 1.2144, its lowest in three weeks, amid persistent dollar’s demand. The market extended Friday’s trading, as there were no fresh catalysts to drive investors. The focus remains on speculation about further fiscal stimulus lifting government debt yields and the greenback advancing alongside. Wall Street traded with a soft tone but managed to recover from intraday lows, putting some pressure on the greenback ahead of the daily close.
The macroeconomic calendar has little to offer this week. The EU published January Sentix Investor Confidence, which improved by more than anticipated from -2.7 to 1.3. The US calendar had nothing to offer. On Tuesday, the Union won’t publish relevant data, while the US will offer some minor reports related to business optimism and employment.
The EUR/USD pair bounced from the mentioned low, but remains in the red, trading in the 1.2170 price zone. The 4-hour chart shows that it met buyers around a bullish 200 SMA, but also that it has broken below the 20 and 100 SMAs, with the shorter accelerating its decline above the longer one. Technical indicators are bouncing from oversold readings, but remain well into negative levels, lacking directional strength. The risk remains skewed to the downside, with the decline set to continue on a break below 1.2125.
Support levels: 1.2125 1.2080 1.2040
Resistance levels: 1.2210 1.2250 1.2300
USDJPY
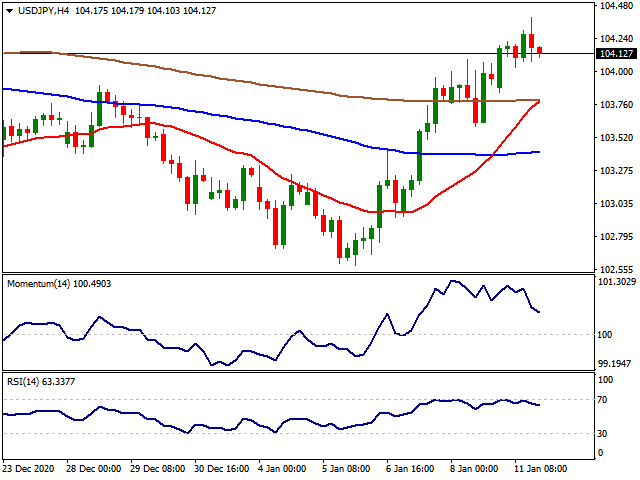
The USD/JPY pair hit 104.39, its highest in over three weeks, to close the day in the 104.10 price zone. The pair advanced for a fourth consecutive day, underpinned by rising US Treasury yields, as the yield of the benchmark 10-year note surged to 1.14%, its highest since March last year. Hopes that upcoming US President Joe Biden will work in a new stimulus program “in the trillions of dollars,” according to his own words, maintain safe-haven assets under pressure.
Japan didn’t publish macroeconomic data on Monday, as local markets were close due to a local holiday. The country will release its November Trade Balance and the December Eco Watchers Survey during the upcoming Asian session.
The USD/JPY pair could extend its advance during the upcoming sessions, according to intraday technical readings. The 4-hour chart shows that it is well above all of its moving averages, with a sharply bullish 20 SMA about to cross above the 200 SMA. Technical indicators eased from overbought territory, but the RSI is stable at around 64, indicating limited selling interest. The pair keeps approaching a long-term descendant trend line in the 104.50 price zone, with gains above it opening doors for a steeper advance.
Support levels: 103.85 103.50 103.15
Resistance levels: 104.50 104.90 105.30
GBPUSD
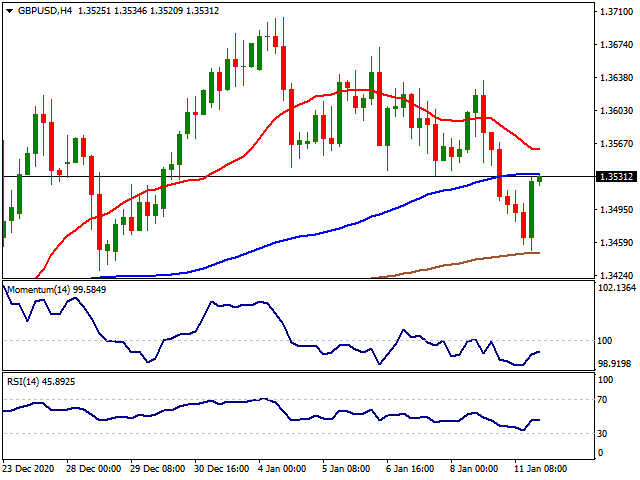
The GBP/USD pair trades around 1.3510, recovering from a daily low of 1.3450, still down for the day. The pair got to recover during US trading hours, as demand for the greenback eased. Nevertheless, the recovery was limited by UK woes. Prime Minister Boris Johnson warned the UK is at a “very perilous moment” in the pandemic, as a surge on coronavirus cases has put pressure on the health system. The PM added that they are now in a “race against time” to curb contagions amid fears the health system may become overwhelmed.
Also, BOE’s MPC member, Silvana Tenreyro, said that in the UK, it is possible that more stimulus will be needed. Regarding negative rates, she said that she has nothing new to add to the matter. The UK has quite a light macroeconomic calendar but will publish early Tuesday the December BRC Like-For-Like Retail Sales, foreseen at 7.9% from 7.7% previously.
The GBP/USD pair trades in the 1.3530 price zone, just below the base of its previous range, which somehow maintains the risk skewed to the downside. In the 4-hour chart, the pair bounced from a mildly bullish 200 SMA and remains below the 20 and 100 SMAs. Technical indicators recovered from intraday lows but turned flat within negative levels. Bulls could have better chances if the pair recovers beyond 1.3580.
Support levels: 1.3505 1.3470 1.3420
Resistance levels: 1.3580 1.3630 1.3670
AUDUSD
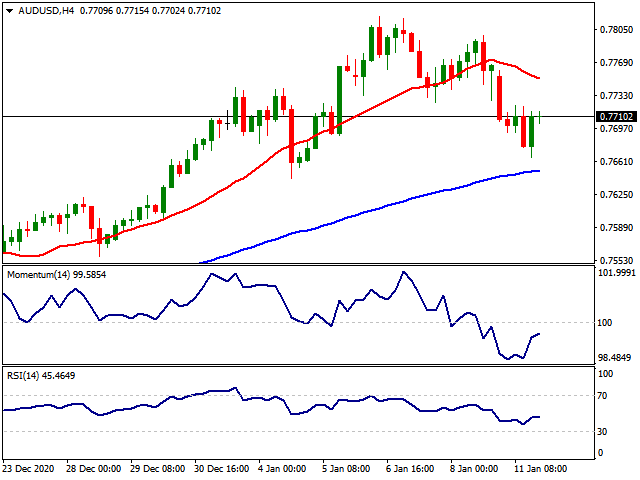
The Australian dollar started the week on the wrong footing, easing against its American rival to 0.7665. Demand for the greenback and a sour market mood undermined AUD/USD, which anyway managed to regain the 0.7700 threshold ahead of the US close. Australian data released at the beginning of the day was generally encouraging, as November Retail Sales were upwardly revised to 7.1%. Also, December TD Securities inflation improved from 1.3% to 1.5% YoY, while the monthly reading came in at 0.5%.
However, the poor performance of equities undermined the pair, alongside extreme overbought conditions after it advanced for the eighth consecutive weeks. Australia won’t publish relevant macroeconomic data this Tuesday.
The AUD/USD pair has limited bullish potential in the near-term, and the corrective decline has room to continue. The 4-hour chart shows that the 20 SMA has turned lower above the current level, but also that the longer ones maintain their bullish slopes below the daily low. Technical indicators recovered from intraday lows, but lost their bullish strength and develop within negative levels. Renewed selling pressure below 0.7670 should favor a decline toward the 0.7580 region.
GOLD
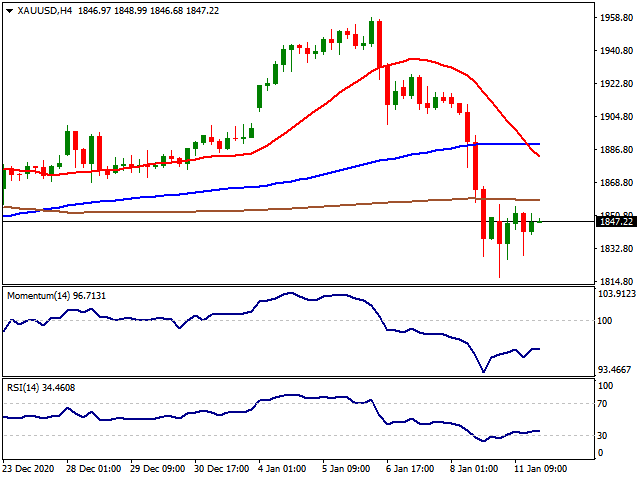
Gold had another volatile session on Monday trying to hold its ground against further declines. Last week the yellow metal rejected at the $1,950 barrier once again and with the sharp rally seen in the US 10-year yields, precious metals faced heavy selling pressure. The rally seen in the yields is still intact and on Monday the US 10-year yields tested 1.13 printing 2.14% on a daily basis. On the other hand, the USD index DXY gained traction over 90.00 levels giving extra pressure to Gold. Despite the negative effects of the yields and USD, Gold faced a buying correction and managed to get away from its daily lows at $1,817.
If Gold manages to build a base here, higher lows since the end of November might indicate further all-time highs are in play with the pandemic era monetary policies in play. Gold managed to test $1,950 before the US session but then reversed its course testing $1,900 level. From the technical point of view, below the $1,860 level, the supports can be followed at $1,800, $1,763 ($1,451-$2,075 61.80%) and $1,700 levels. Over the $1,860 level, the resistances can be followed at $1,900 with $1,956 ($1,451-$2,075 38.20%) and $2,000 levels.
Support Levels: $1,800 $1,763 $1,700
Resistance Levels: $1,900 $1,956 $2,000
SILVER
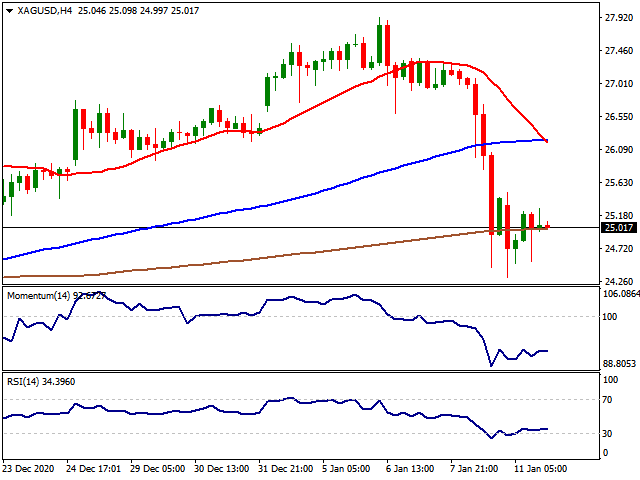
Silver continued to follow Gold as the precious metals, in general, stayed under heavy selling pressure with the rally seen in the US 10-year yields and also the USD index DXY. After spending quite a time below the 90.00 level, finally, the greenback managed to lift over the physiological level. Despite the pandemic volatility, Silver was the winner of 2020 in terms of annual gains. With China’s fast recovery from the pandemic, industrial metals like Silver and Copper will most likely outperform Gold again with the expected increase in the manufacturing activity. On the other hand, the Gold to Silver ratio is far from ideal, still hitting over 73.00 again.
If Silver manages to stay over $27.00, next targets upside might be followed at $29.28 (March 2013 resistance) and $30.00 levels. Below the $27.00 level, the supports might be followed at $25.00, $24.00 and $23.38 levels.
Support Levels: $25.00 $24.00 $23.38
Resistance Levels: $27.00 $29.28 $30.00
DOW JONES
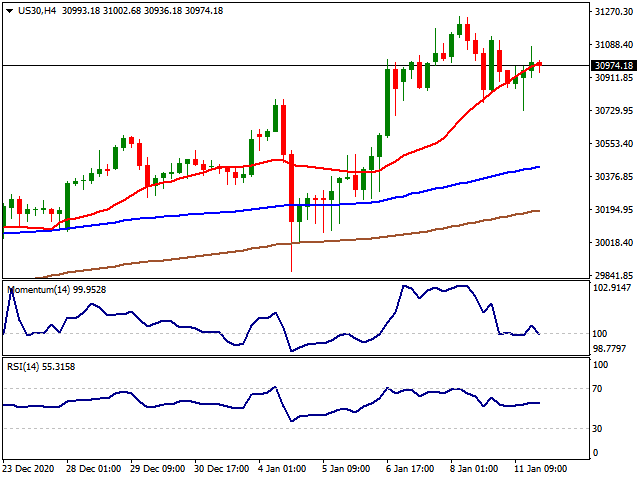
Social Media platform’s war against the president Trump dragged their shares lower which halted the rally in the US indexes so far. Social media platforms have taken some strong positions following the Capitol riots and that is raising expectations that when the dust settles, Congressional efforts to regulate big tech will become high on the agenda. On the other hand, in the aftermath of the capitol riots, House Democrats have begun the impeachment process today as they charge the president with “incitement of insurrection”. The House, however, may not send over the article of impeachment to the Senate until after inauguration day. While the rally was seen in the US 10-year yields continue, the USD index DXY managed to lift over the 90.00 level again. Markets are gearing up for the Biden administration in a fashionable way. However, the US Trade Representative Robert Lighthizer urged President-elect Joe Biden's government to continue to maintain the tariffs imposed on China, The Wall Street Journal reported Monday, citing an interview with the outgoing trade chief. China, which faces $370 billion in annual US tariffs, last year agreed to buy an additional $200 billion in US goods and services, open its financial markets and take off some pressure from US companies to transfer technology.
From the technical point of view, if the index stays over 31,000, 32,000 and 32,500 levels can be followed as new targets high while below the 31,000 level, 30,000 and 29,500 levels can be followed as supports.
Support Levels: 31,000 30,000 29,500
Resistance Levels: 32,000 32,500 33,000
WTITITI
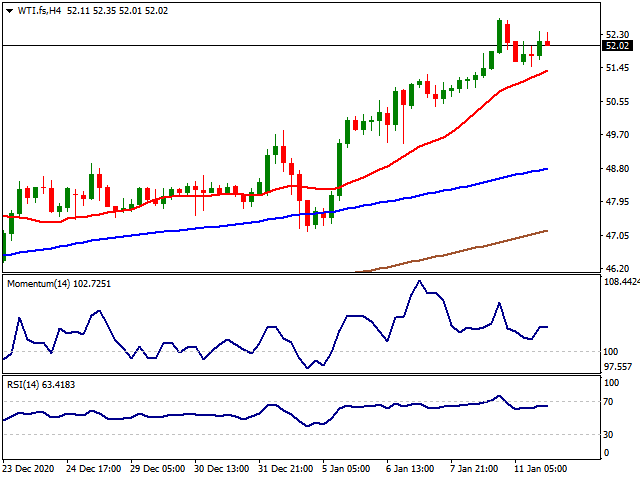
WTI faced a technical correction on Monday after the impressive rally that carried the block gold to its almost pre-pandemic levels. Oil traders tend to ignore the difficulties in the vaccine distribution and the worsening situation in the US and UK, especially at the moment. The stimulus developments with the clear Democrat win in the US combined with OPEC+ voluntarily production cuts are driving the oil prices higher. On the other hand, the USD index managed to gain traction pressuring WTI on Monday after spending a long period below the 90.00 level.
While the WTI is at overbought levels in terms of RSI(14), markets might need a new catalyst to move the prices further high apart from the current drivers. If WTI keeps its position below 52.00$ level, 51.03$ (October 2019 low), 50.60$ (June/August 2019 support) and 50.00$ levels can be followed as new targets. Over the 53.00$ level, the resistances might be followed at 53.93$ (63.33$-51.03$ %23.60), 55.73$ (63.33$-51.03$ %38.20) and 57.13$ (63.33$-51.03$ %50.00).
Support Levels: 51.03$ 50.60$ 50.00$
Resistance Levels: 53.00$ 53.93$ 55.73$
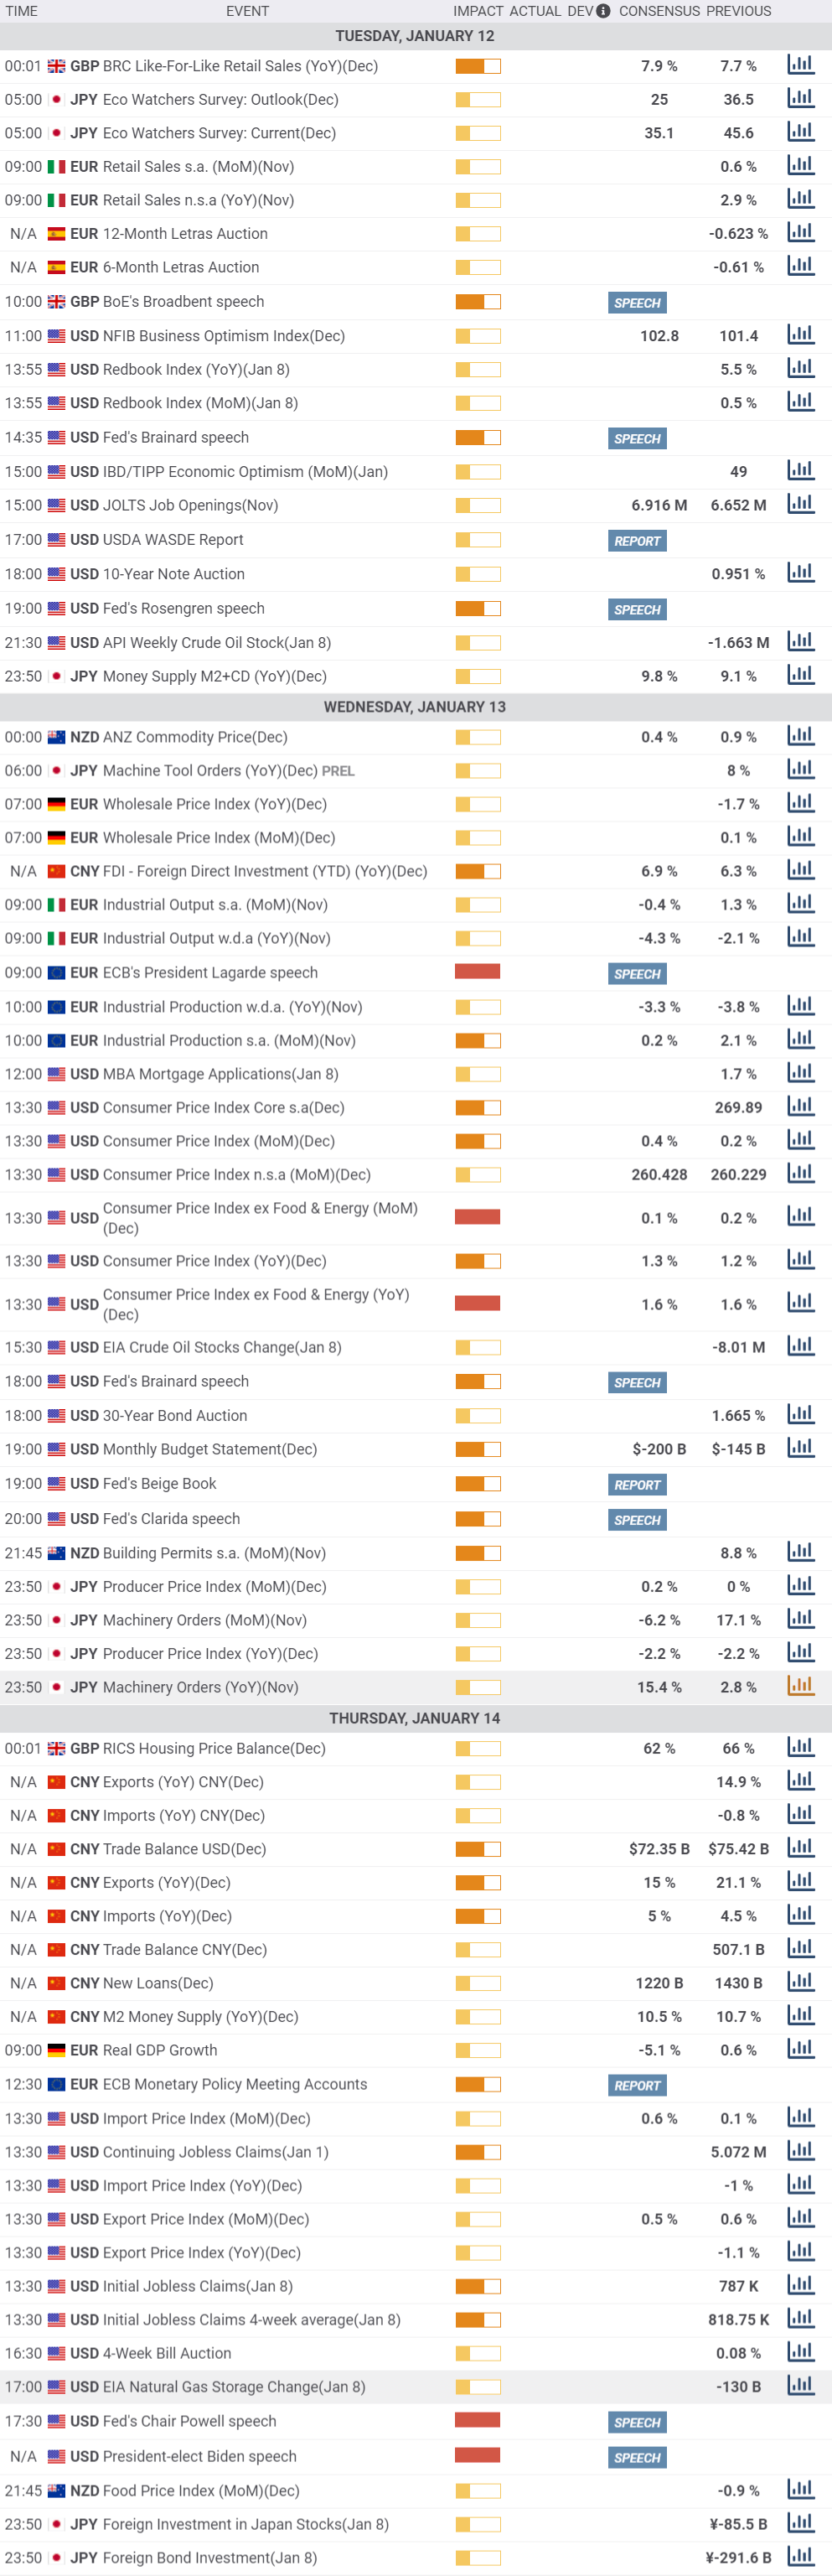
MACROECONOMIC EVENTS
Disclaimer: The content above represents only the views of the author or guest. It does not represent any views or positions of FOLLOWME and does not mean that FOLLOWME agrees with its statement or description, nor does it constitute any investment advice. For all actions taken by visitors based on information provided by the FOLLOWME community, the community does not assume any form of liability unless otherwise expressly promised in writing.
FOLLOWME Trading Community Website: https://www.followme.com


Hot
No comment on record. Start new comment.