Daily Market Report - 11th Jan 2021


Official Website: https://www.nooralmal.com/
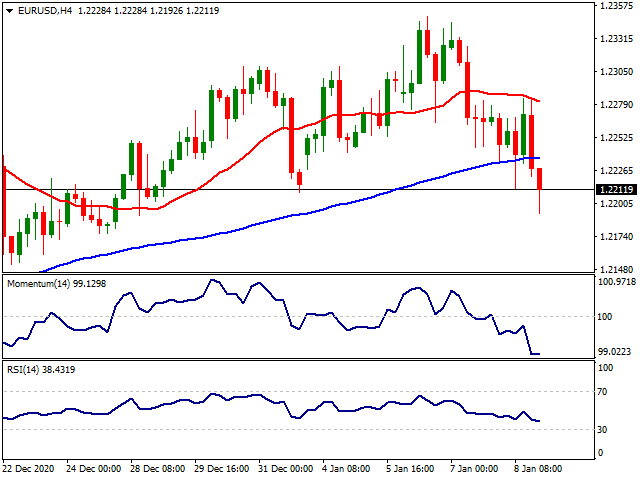
EURUSD
The EUR/USD pair closed the week with modest losses, as the greenback extended its advance on Friday. The pair settled above the 1.2200 level, with the greenback strengthening despite terrible US employment figures. The country released the December Nonfarm Payroll report, which showed that the country lost 140K job positions in December. The unemployment rate remained steady at 6.7%, better than the 6.8% anticipated.
Equities closed with gains, and US Treasury yields kept advancing, as markets rallied on hopes for additional stimulus. On Friday, President-elect Joe Biden called for immediate further fiscal support, including increased direct payments of $ 2,000. The pandemic has brutally spread across the US, reporting over 300K daily new cases in one day by the end of the week.
This Monday, the EU will publish January Sentix Investor Confidence, foreseen at 0 from -2.7 in the previous month. The US won’t release relevant macroeconomic figures.
The EUR/USD pair has fallen for a second consecutive day, but the daily chart shows that the price is hovering around a bullish 20 SMA, and far above the larger ones, somehow suggesting that the latest decline is corrective. Technical indicators head firmly lower, the Momentum crossing its midline and the RSI around 54, indicating that the decline may continue. The risk is skewed to the downside in the 4-hour chart, as technical indicators hold at recent lows near oversold readings, as the pair develops below its 100 SMA for the first time since early November.
Support levels: 1.2190 1.2140 1.2100
Resistance levels: 1.2230 1.2285 1.2340
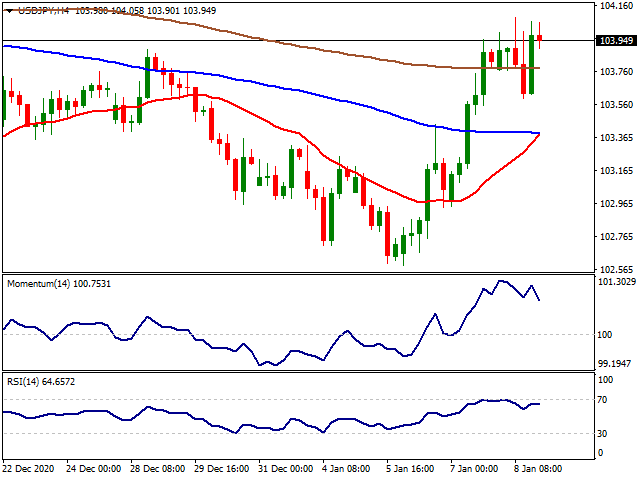
USDJPY
The USD/JPY pair hit on Friday 104.08, its highest in three weeks, to settle just below the 104.00 threshold. As it happened for most of the week, the pair found support in US Treasury yields, which advanced to levels that were last seen in March 2020. The yield of the benchmark 10-year note hit 1.13% despite the disappointing Nonfarm Payroll report, finishing the week at 1.12%. Wall Street posted modest gains, as job’s loss fueled speculation for additional stimulus.
Japan published on Friday The preliminary estimate of the November Leading Economic Index, which beat expectations, improving to 96.6 from 94.3. The Coincident Index for the same period, however, resulted at 89.1 from 89.4 previously. Japan celebrates a holiday this Monday, and won’t publish macroeconomic data.
The USD/JPY pair is bullish in the daily chart, as it has settled above its 20 SMA for the first time in almost two months. The Momentum indicator heads firmly higher well into positive territory, while the RSI loses bullish momentum but stands around 54. A daily descendant trend line coming from March 2020 comes at around 104.50, and gains beyond it could anticipate a more sustainable advance.
The 4-hour chart shows that technical indicators are retreating modestly from overbought levels, while the pair is above all of its moving averages, all of which maintains the risk of a steeper decline limited.
Support levels: 103.60 103.25 102.80
Resistance levels: 104.05 104.30 104.75
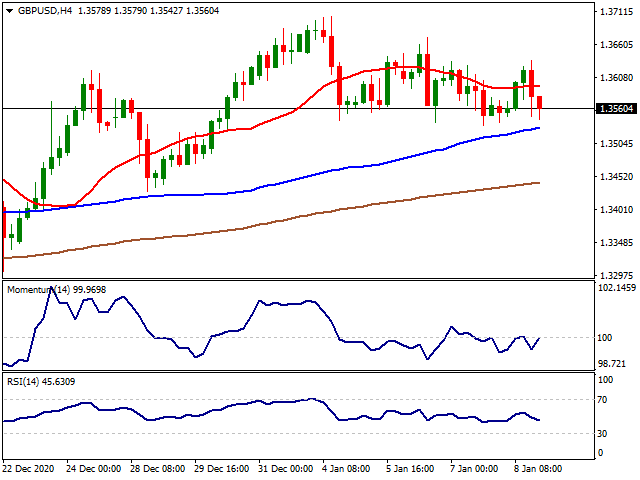
GBPUSD
The GBP/USD pair closed Friday unchanged at 1.3560, down weekly basis but within familiar levels. Demand for sterling has been undermined by coronavirus developments in the UK, as, despite the tough lockdown announced late in December, the number of new cases keeps increasing, and menacing the health systems which is at a brink of collapse. The kingdom is drawing a plan to vaccinate at least once each citizen, to accelerate immunization, approving on Friday the use of a third vaccine, the Moderna one.
Data wise, the UK had nothing relevant to offer last week and has a quiet one ahead. On Monday, the focus will be on BOE’s Governor Andrew Bailey. Bailey has already warned that Brexit would mean a 4% on GDP in the long-term. Speculative interest is anticipating chances of negative rates in the kingdom, amid the double hit from Brexit and covid.
From a technical point of view, the daily chart of the GBP/USD pair indicates a limited bearish potential. The pair continues to develop above bullish moving averages, with the 20 SMA providing dynamic support at around 1.3500. The Momentum is heading south within neutral levels, but the RSI is stable at 55. In the near-term, and according to the 4-hour chart, the pair is neutral-to-bearish, trapped between directionless moving averages and with technical indicators hovering below their midlines without clear directional strength.
Support levels: 1.3505 1.3470 1.3420
Resistance levels: 1.3580 1.3630 1.3670
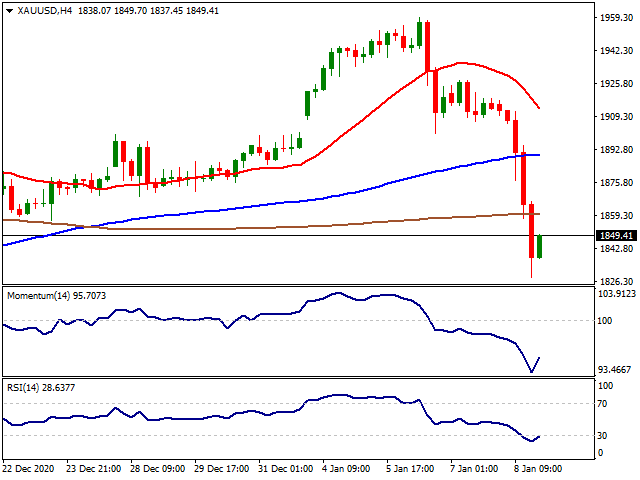
GOLD
Gold faced another massive sell-off action on Friday pressured by the incline seen in the 10-year US yields. The yield hit 1.119 printing a 1.06% incline on a daily basis while the USD index DXY managed to lift itself over the 90.00 level. The USD index DXY had a sudden decline in the aftermath of the worse than expected NFP data but than managed to regain traction. On the trader’s side, Gold futures’ NET LENGTH soared +10 446 contracts to 279 318 while silver futures’ NET LENGTH added +772 contracts to 55 551. Both precious metals stayed under pressure with the profit taking correction despite the increase in net-long futures. The sell-off continued despite the fundamentals in the aftermath of clear Democrat Blue Wave win as the traders preferred to weigh on the US bonds.
The week ahead will kick-off with the inflation data release from China on Monday. On Tuesday, the Fed’s Rosenberg and Brainard’s speech will be followed. On Wednesday, the inflation data set in the US will be important as precious metals are a good hedge option against inflation. Fed’s official and Beige Book will also be followed on Wednesday. On Thursday, Chinese trade balance data and Powell’s speech will be the highlight of the day. Finally, on Friday, Retail Sales data with the Michigan Consumer Sentiment Index (Jan) PREL will be followed.
Gold managed to test $1,950 before the US session but then reversed its course testing $1,900 level. From the technical point of view, below the $1,860 level, the supports can be followed at $1,800, $1,763 ($1,451-$2,075 61.80%) and $1,700 levels. Over the $1,860 level, the resistances can be followed at $1,900 with $1,956 ($1,451-$2,075 38.20%) and $2,000 levels.
Support Levels: $1,800 $1,763 $1,700
Resistance Levels: $1,900 $1,956 $2,000
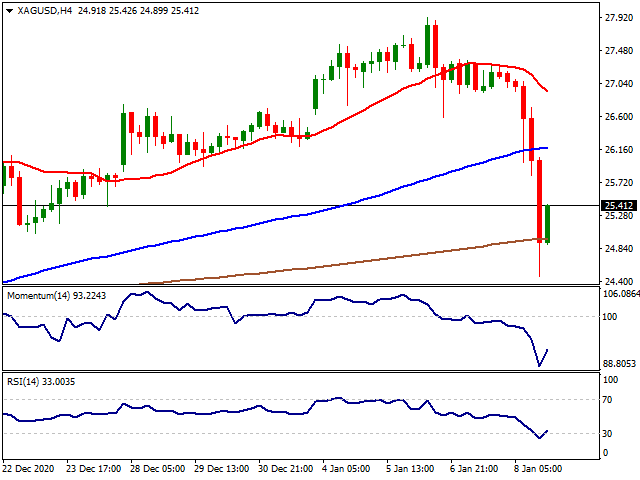
SILVER
Silver also faced further selling pressure on Friday pressured by the rally seen in the US 10-year yields. Under normal conditions, the Blue Wave acquired by the Democrats should fundamentally support the precious metals. Despite the sharp technical correction seen in the precious metals last week, net-long futures continued to add up due to the CFTC Commitments of Traders data. Gold to Silver ratio once again lifted to 72.00 levels. On the other hand, Silver was the winner in 2020 compared to Gold.
If Silver manages to stay over 27.00$, next targets upside might be followed at 29.28$ (March 2013 resistance) and 30.00$ levels. Below the 27.00$ level, the supports might be followed at 25.00$, 24.00$ and 23.38$ levels.
Support Levels: 25.00$ 24.00$ 23.38$
Resistance Levels: 27.00$ 29.28$ 30.00$
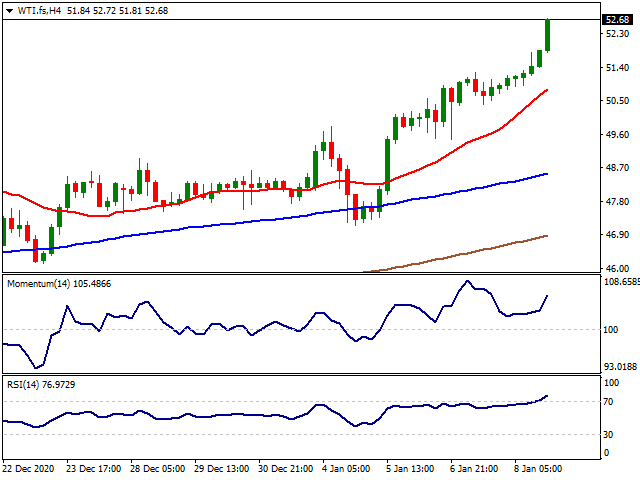
CRUDE WTI
WTI continued its solid incline lifting to its pre-pandemic crash levels. There were no further fundamentals on Friday to support the rally apart from the Democrat Blue Wave which will end up further stimulus than expected and voluntarily production cuts from OPEC+. Also, due to the EIA data, inventories dropped 8M barrels indicating further lockdowns did not hurt the demand as its feared. On the other hand, worse than expected NFP reading did not hurt the sentiment which helped WTI to rally. Despite the current grim reality on the pandemic, traders tend to price a quicker resolution as the vaccine roll-out started which will secure the oil consumption.
If WTI keeps its position below 52.00$ level, 51.03$ (October 2019 low), 50.60$ (June/August 2019 support) and 50.00$ levels can be followed as new targets. Over the 53.00$ level, the resistances might be followed at 53.93$ (63.33$-51.03$ %23.60), 55.73$ (63.33$-51.03$ %38.20) and 57.13$ (63.33$-51.03$ %50.00).
Support Levels: 51.03$ 50.60$ 50.00$
Resistance Levels: 53.00$ 53.93$ 55.73$
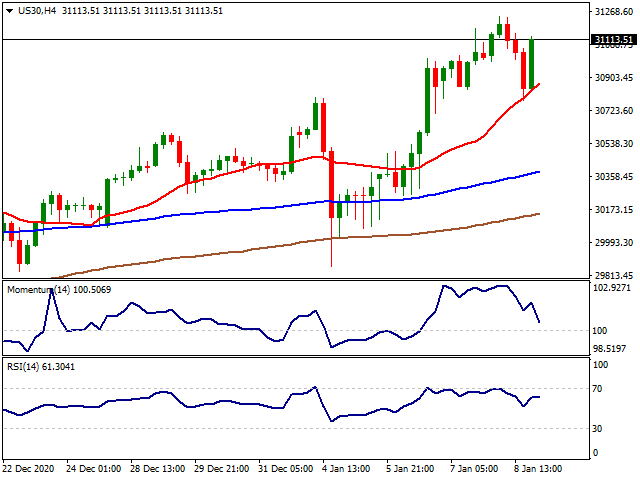
DOW JONES
Despite the gloomy NFP reading, Dow Jones managed to end the day on a positive note close to its all-time high around 31,500. The US economy lost 140,000 jobs in December, which was much worse than the consensus estimate for a gain of 50,000 jobs but stayed in line with the expectations. On the other hand, the previous release revised +135K. Most likely, the positive mood in the markets is fueled by the expectation of a bigger stimulus package by the Democrats triggered by the weak data releases. Biden said on Friday that his stimulus proposals would include higher unemployment payments. "It is necessary to spend the money now," Biden said in a news conference. "The answer is yes, it will be in the trillions of dollars, an entire package."
This week will be busy in terms of the macro releases scheduled in the US. Fed official’s speeches will be followed along the week with Powell’s speech on Thursday highlighted. Also, the inflation data set in the US will be released on Wednesday along with Fed’s Beige Book. Finally, on Friday, Retail Sales data with the Michigan Consumer Sentiment Index (Jan) PREL will be followed.
From the technical point of view, if the index stays over 31,000, 32,000 and 32,500 levels can be followed as new targets high while below the 31,000 level, 30,000 and 29,500 levels can be followed as supports.
Support Levels: 31,000 30,000 29,500
Resistance Levels: 32,000 32,500 33,000
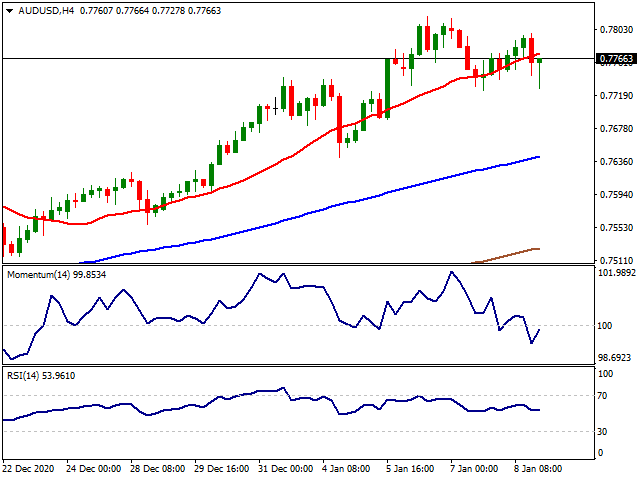
AUDUSD
The AUD/USD pair settled at 0.7760, advancing for an eighth consecutive week. The pair fell on Friday to 0.7727 amid the prevalent dollar’s demand, later bouncing on risk-appetite. The aussie ignored a collapse in gold prices, with the bright metal extending its weekly decline to 1,850, instead following the lead of US indexes, which closed the week with sharp gains at record levels.
Australia will start the week publishing November Retail Sales, previously estimated at 7%. Market players will also be watching Chinese December inflation figures. The annual CPI in the country is foreseen at 0.1% improving from -0.5% previously.
The AUD/USD pair has room to extend its advance, as, in the daily chart, the pair continues to develop far above bullish moving averages. Technical indicators have retreated from their recent highs, the Momentum easing within range, yet the RSI consolidating at 69, indicating absent selling interest. In the shorter-term, and according to the 4-hour chart, pair is below a still bullish 20 SMA, while the Momentum indicator recovers below its midline, suggesting that the pair may need to advance the 0.7815 price zone to gather bullish momentum.
Support levels: 0.7725 0.7670 0.7630
Resistance levels: 0.7815 0.7850 0.7890
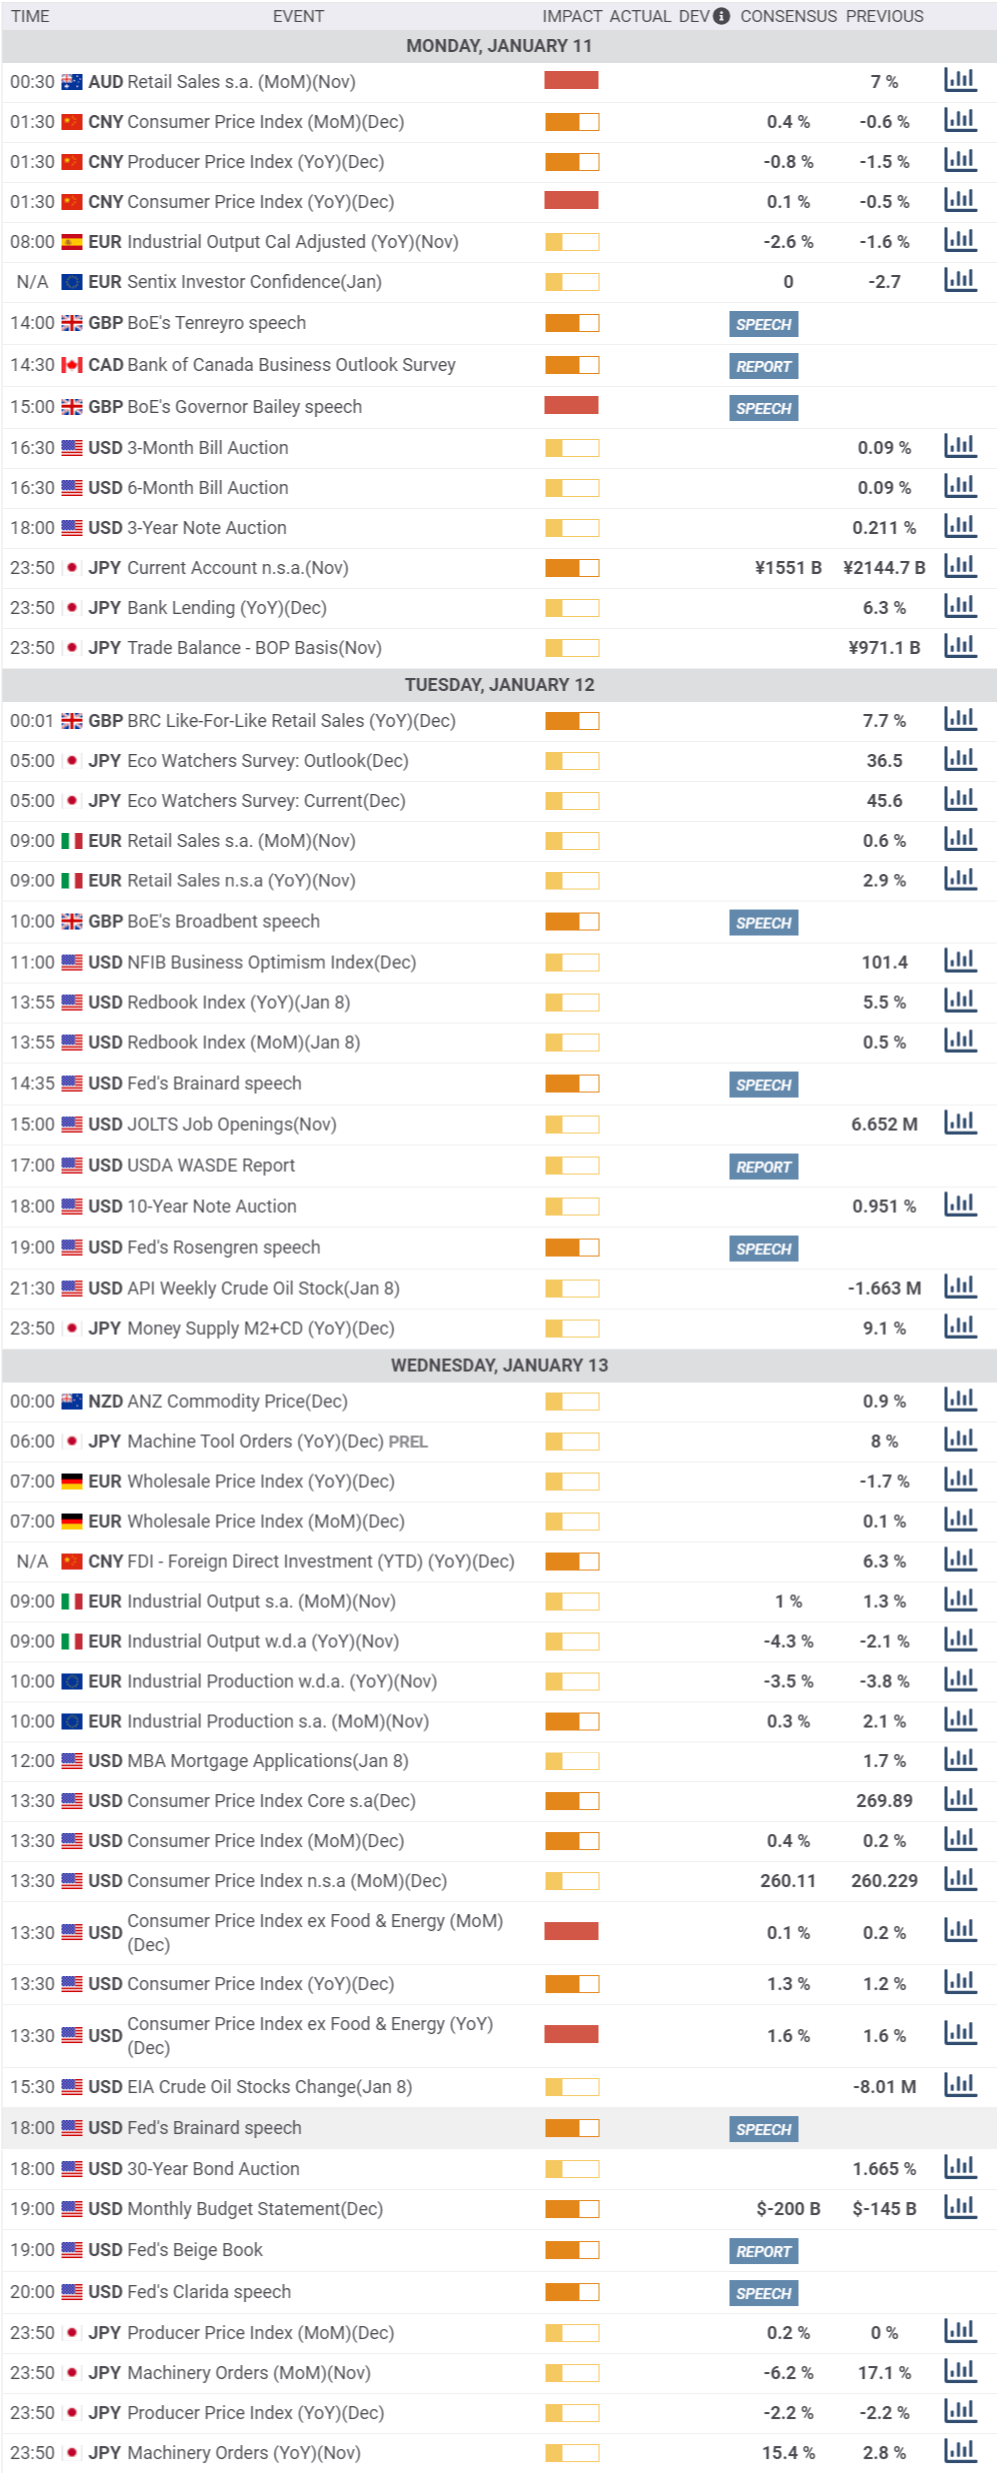
MACROECONOMIC EVENTS
Disclaimer: The content above represents only the views of the author or guest. It does not represent any views or positions of FOLLOWME and does not mean that FOLLOWME agrees with its statement or description, nor does it constitute any investment advice. For all actions taken by visitors based on information provided by the FOLLOWME community, the community does not assume any form of liability unless otherwise expressly promised in writing.
FOLLOWME Trading Community Website: https://www.followme.com


Hot
No comment on record. Start new comment.