Daily Market Report - 26th Nov 2020


NCM Investment - The Festival of GOLD
OPEN ACCOUNT AND GET A CHANCE TO WIN GOLD
For more details: https://www.nooralmal.com/gold...
Official Website: https://www.nooralmal.com/
EURUSD
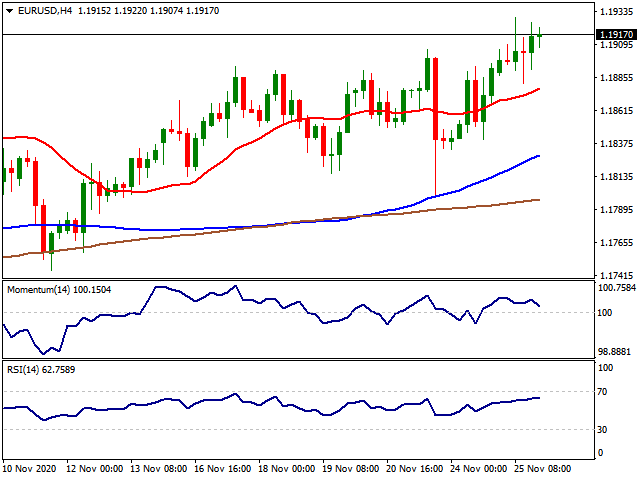
The EUR/USD pair advanced on Wednesday, reaching a fresh 2-month high of 1.1929 during the European session, to later refresh it in the US session. Optimism prevailed throughout the first half of the day but eased ahead of the American opening on the back of Brexit concerns. The greenback remained under pressure after the release of a batch of mixed US data, as the country will be off for the long Thanksgiving holiday.
Durable Goods Orders were up 1.3% in October, beating expectations, while the core reading printed at 0.7% against the 0.5% forecast. Q3 economic growth was confirmed at 33.1%, while Initial Jobless Claims for the week ended November 20 came in worse than expected, up to 778K. Finally, the Michigan Consumer Confidence survey was downwardly revised to 76.9 in November. The US calendar will remain empty for the rest of the week. The EU will publish money data this Thursday, while the ECB will release the Minutes of its latest meeting.
The EUR/USD pair trades around 1.1914, with the risk skewed to the upside, despite the lack of bullish momentum. In the 4-hour chart, the pair is trading above a bullish 20 SMA, which advances beyond the longer ones. Technical indicators advance just modestly within positive levels. Bulls are in control as long as the price holds above 1.1880, the US session low, with scope to test the year´s high at 1.2011.
Support levels: 1.1880 1.1840 1.1790
Resistance levels: 1.1960 1.2010 1.2050
USDJPY
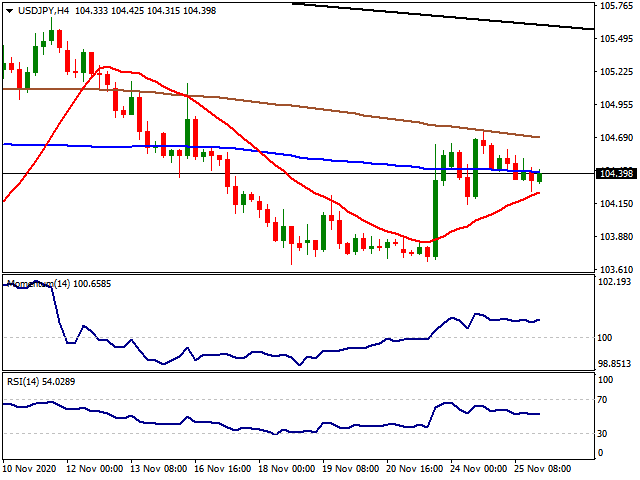
The USD/JPY pair is ending Wednesday pretty much unchanged104.30 price zone, undermined by the broad dollar’s weakness and the soft tone of worldwide indexes. Investors were not interested in the greenback, which came under pressure on the back of easing optimism. Mixed US data and Brexit concerns hurt the positive mood.
Wall Street traded mixed, while US government debt edged modestly lower, reflecting the fading enthusiasm. On the data front, Japan published the October Corporate Services PMI, which fell by 0.6% YoY, much worse than the 1.2% advance expected. The country will publish the final version of the September Leading Economic Index, foreseen unchanged at 92.9, and the Coincident Index for the same month, expected at 80.8.
The USD/JPY pair is neutral-to-bullish, trading between a bullish 20 SMA and a flat 100 SMA in its 4-hour chart. The 200 SMA provided dynamic resistance earlier this month, now at around 104.70. In the meantime, technical indicators stand within positive levels, lacking directional strength. Bulls will have better chances if the pair recovers above the 105.00 mark.
Support levels: 103.95 103.50 103.15
Resistance levels: 104.65 105.00 105.40
GBPUSD
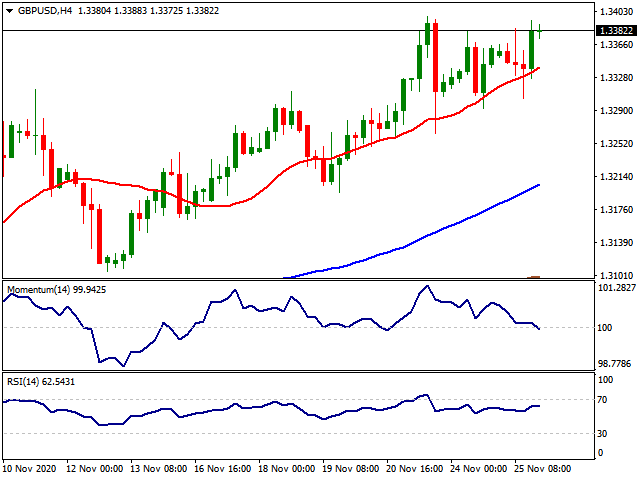
The GBP/USD pair is ending Wednesday near a daily high of 1.3393, holding on to intraday gains despite not so optimistic Brexit headlines. The pair fell to 1.3303 following comments from European Commission’s chief Ursula von der Leyen, who warned a Brexit deal is far from certain. Also, the EU’s chief negotiator Michel Barnier has menaced to pull out of the negotiation table if the UK is not willing to compromise on the outstanding issues. Fisheries’ rights are at the top of the list. Still, speculative interest ignored the gloomy headlines and kept selling the greenback.
The UK macroeconomic calendar has nothing relevant to offer for the rest of the week. Brexit headlines, on the other hand, may introduce big noise in thinned trading due to a US holiday.
The 4-hour chart for the GBP/USD pair shows a potential divergence coming from the Momentum indicator, as the pair keeps advancing while the indicator keeps decreasing, now piercing its midline. A bullish 20 SMA provides support around 1.3340, and a break below it could be the first sign of a bearish corrective decline. An extension above 1.3410, on the other hand, could lead to a test of the 1.3500 threshold.
Support levels: 1.3340 1.3290 1.3250
Resistance levels: 1.3410 1.3460 1.3500
AUDUSD
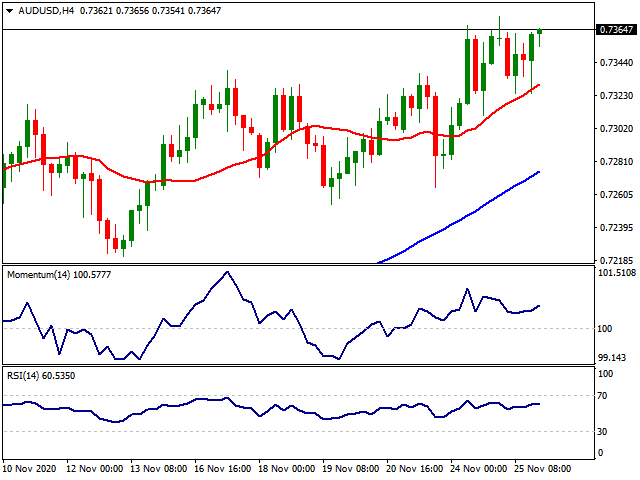
The AUD/USD pair held around 0.7360 this Wednesday, trapped between the broad greenback´s weakness and the equities’ poor performance. The pair extended its monthly rally by a few pips, reaching 0.7373. Australia published at the beginning of the day Q3 Construction Work Done, which came in at -2.6%, worse than the -2% expected. During the upcoming Asian session, the country will publish Q3 Private Capital Expenditure, foreseen at -1.5%.
From a technical point of view, the upside remains favored for the AUD/USD pair. The 4-hours chart shows that a bullish 20 SMA continued to provide intraday support, now around 0.7330. Technical indicators remain flat but within positive levels while the 100 and 200 SMAs have accelerated north well below the current level. A steeper advance should be expected on a break above 0.7413, this year’s high.
Support levels: 0.7330 0.7290 0.7250
Resistance levels: 0.7370 0.7415 0.7540
GOLD
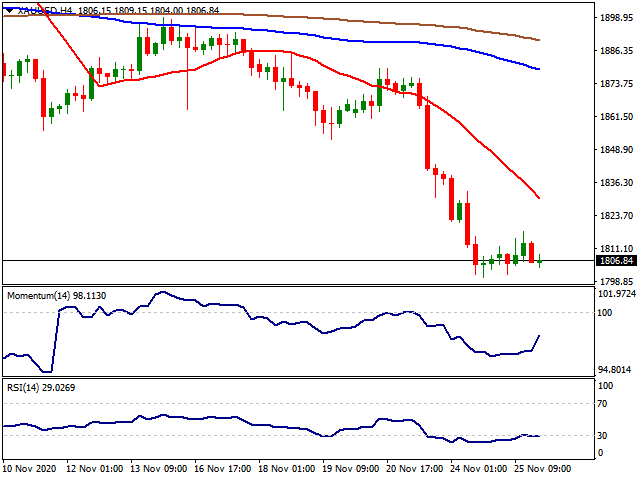
Gold tried to protect an important physiological support level of $1,800 on Wednesday after the vaccine and political optimism pushed the yellow metal $70 in two trading sessions. At this point, the fate of Gold lies between the vaccine developments as expectations, realities connected to the direction of the pandemic with possible extra lockdown measures implied in January and their effects on the macro-data sets and the expected stimulus deal. Markets at this point prefer to price the expectations of the vaccine and ignore the realities. While precious metals face heavy selling pressure, the US indexes renew their all-time highs. On the other hand, the US index DXY does not look lively and is having a hard time to get away from 92.00 levels.
From the technical point of view, below the $1,860 level, the supports can be followed at $1,800, $1,763 ($1,451-$2,075 61.80%) and $1,700 levels. Over the $1,860 level, the resistances can be followed at $1,900 with $1,956 ($1,451-$2,075 38.20%) and $2,000 levels.
Support Levels: $1,800 $1,763 $1,700
Resistance Levels: $1,900 $1,956 $2,000
DOW Jones
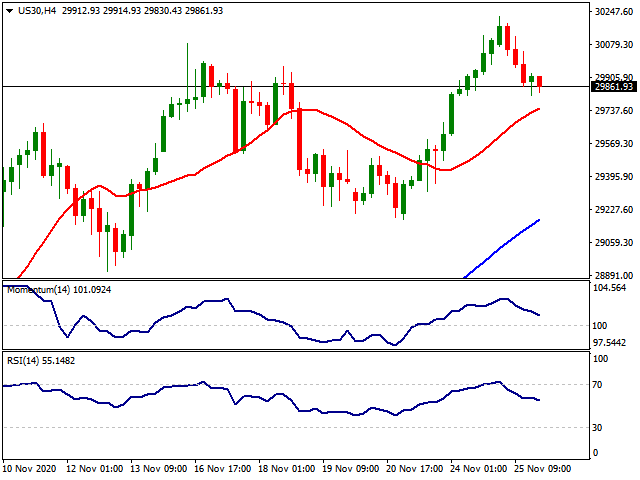
Dow Jones faced a correction influenced by the US jobs data after hitting its all-time level on Tuesday at 30,116. Wednesday had a busy docket in the US as the markets will be closed due to Thanksgiving holiday today. Initial jobless claims rose to a five-week high at 778,000, much higher than the consensus estimate of 730,000. The total number of people claiming benefits in all programs was 20.4 million, an increase of 135,000 from the prior week. The labour market recovery is bracing for a Biden administration that will deliver increased lockdowns as the US aims to get the virus fully under control. The US October advance goods trade data showed a monthly improvement of 2.8% in October, but a substantial 7.5% decline from a year ago. Imports rose 2.2% on a monthly basis and 1.9% year-over-year while the second reading of third-quarter GDP matched the advance reading of 33.1% and provided confirmation that the historic rebound is intact. On the other hand, The October personal income decline of 0.7% was far worse than the expected 0.1% drop, and the prior reading which was revised lower from 0.9% to 0.7%. Personal spending increased 0.5%, slightly better than the economist’s forecast of 0.4%, but was very much lower than the revised prior reading which was revised lower two ticks to 1.2%. The USD index DXY also retreated to 92.00 levels as Jannet Yellen, former Fed Chair nominated as the Secretary of Treasure.
From the technical point of view, if the index stays over 29,000, 29,500 and 30,000 levels can be followed as new targets high while below the 28,400 level, 28,000 and 27,770 can be followed as supports.
Support Levels: 28,400 28,000 27,770
Resistance Levels: 29,500 30,000 30,500
XAGUSD
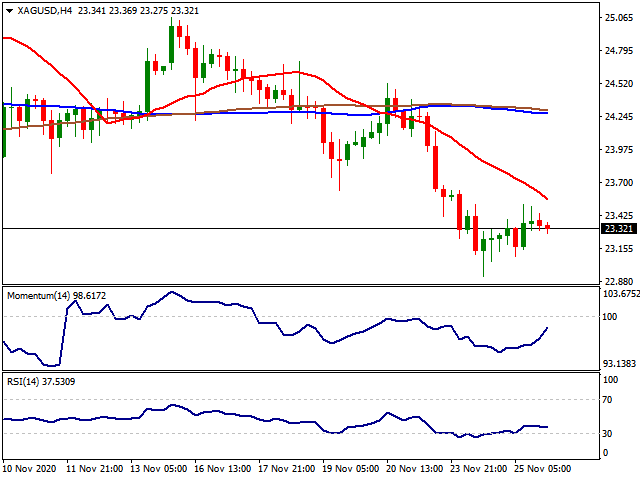
Silver had a better day compared to Gold after spending Monday and Tuesday with a heavy sell-off. The Gold to Silver ratio managed to hold around mid-77.00 levels while $22.90 worked once again as a strong support level. Apart from the current dynamics in the markets, Bank of America stated in a report that Silver is a “metal important for future technologies” (MIFT) and the current focus on decarbonisation/solar panels should support fundamentals in the long run. Also, the elected-president Joe Biden is well known for his support on renewable energy systems. Therefore, besides the current noise about the pandemic and stimulus deal, Silver might be a good shot for the long term.
Below the $22.90 level ($11.63-$29.86 38.20%), the supports can be followed at $20.75 ($11.63-$29.86 50.00%) and $18.42 ($11.63-$29.86 61.80%). Over the $22.90 level, the target's up can be followed at $25.21 ($11.63-$29.86 23.60%), $26.00 (August-September support), $27.00 and $28.00 levels.
Support Levels: $22.90 $20.75 $18.42
Resistance Levels: $25.21 $26.00 $27.00
WTI
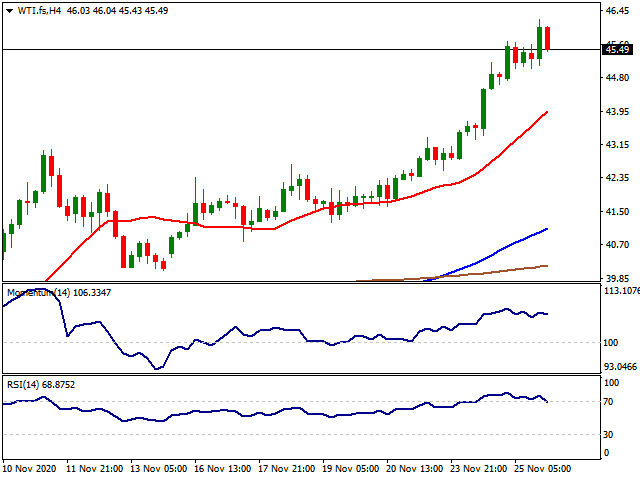
Despite the effects of the second wave of the pandemic, which hit the US harder than the first one, WTI kept its incline on the sixth consecutive day testing over $45.00 levels. It is highly expected the OPEC+ will roll over the current oil output next week to fight with the second wave of the pandemic. On the other hand, the EIA crude oil inventory report showed a small decline in stockpiles. Crude oil inventories fell 754,000 barrels, better than the expected build of 234,000, and nowhere near last night’s API build of 3.8 million barrels. It wasn’t completely a bullish report as gasoline stockpiles rose almost 3X than expected to 2.18 million barrels and US production posted another weekly increase. Apart from the vaccine optimism, the Fed might have to intervene in the markets on a bigger scale depending on the latest series of macro-data.
Next supports can be seen at 45.00$, 43.88$ and 43.00$ respectively while the resistances can be followed at 47.00$ and 48.50$.
Support Levels: 45.00$ 43.88$ 43.00$
Resistance Levels: 46.00$ 47.00$ 48.50$
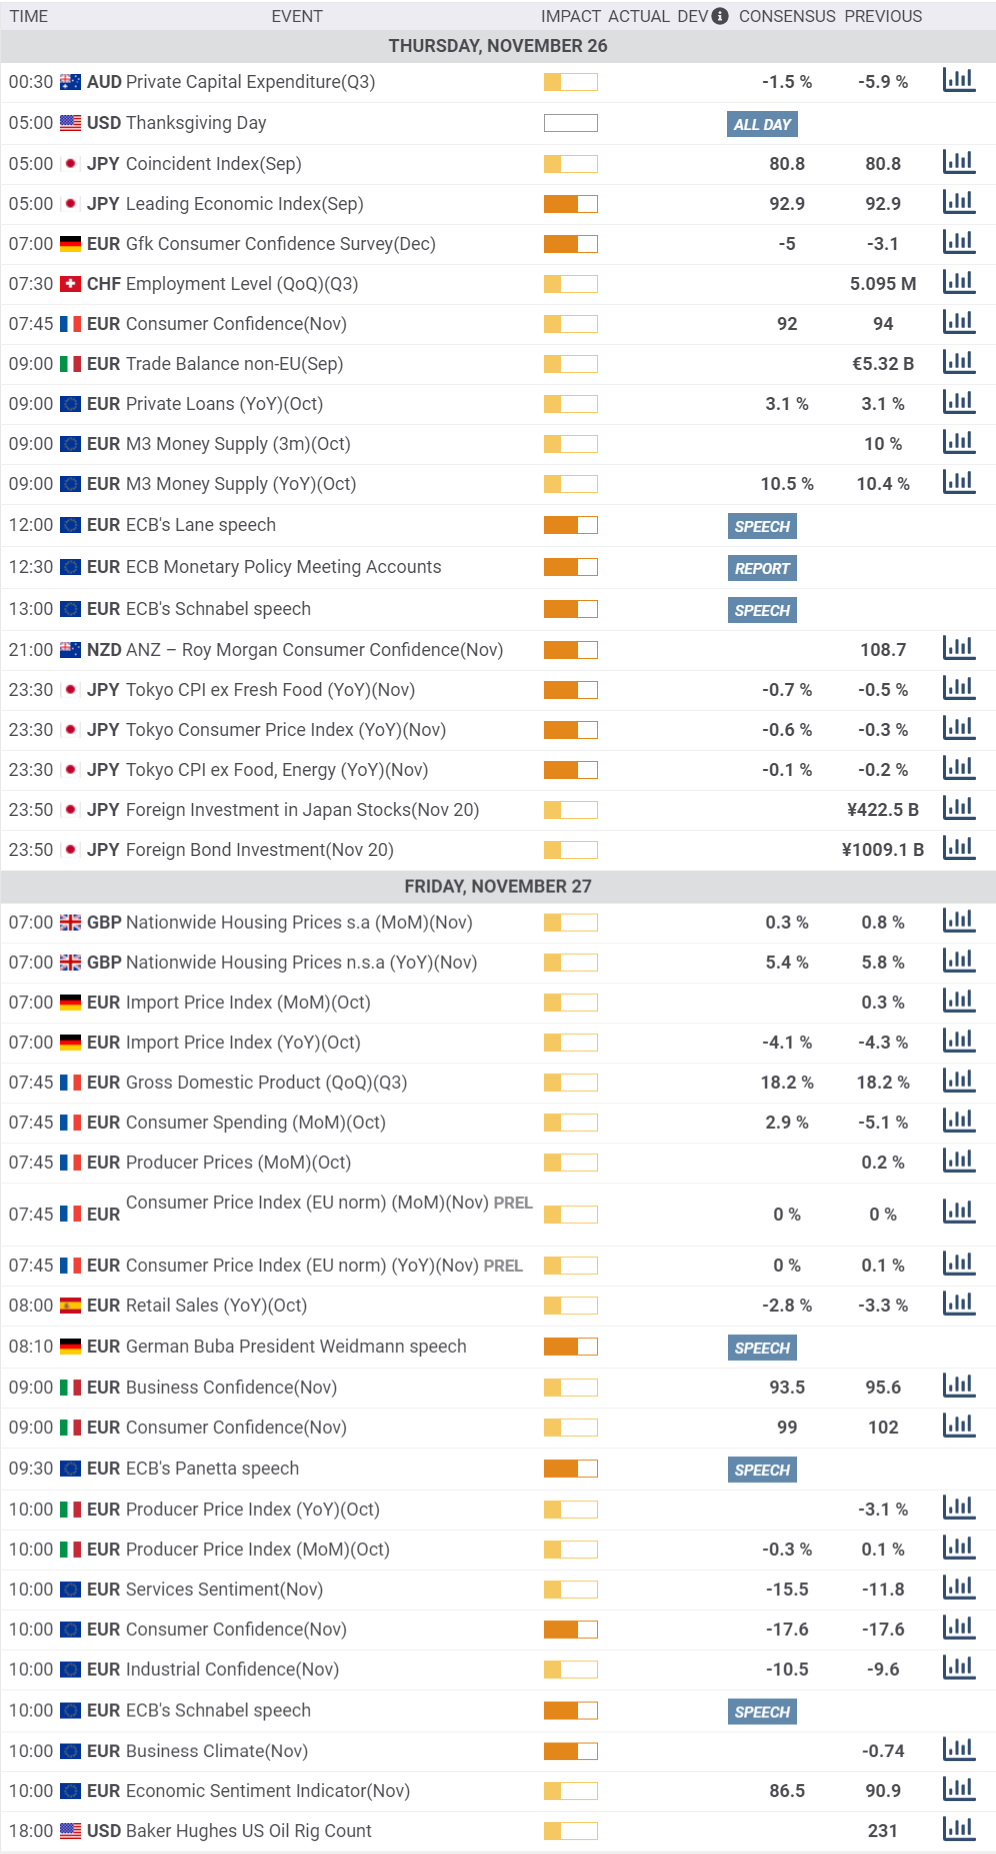
MACROECONOMIC EVENTS
* All the Moving Average support and resistance levels are dynamic by nature. Means when the price approaches the Moving averages, slight variation occurs in the forecasted Moving Average support and resistance levels. Previous few days’ intraday levels are also signicant while trading the current day as the price tend to hover around these levels for some time. Levels in red indicate strong, critical or vital.
Please remember that trading financial markets carry a high degree of risk to your capital. It is possible to lose more than your initial stake. Leveraged products may not be suitable for all investors, therefore please ensure you fully understand the risks involved and seek independent advice if necessary.
All Rights Reserved © Noor Al Mal
Disclaimer: The content above represents only the views of the author or guest. It does not represent any views or positions of FOLLOWME and does not mean that FOLLOWME agrees with its statement or description, nor does it constitute any investment advice. For all actions taken by visitors based on information provided by the FOLLOWME community, the community does not assume any form of liability unless otherwise expressly promised in writing.
FOLLOWME Trading Community Website: https://www.followme.com


Hot
No comment on record. Start new comment.