Gold Price Analysis: XAU/USD eyes 200-day SMA

- Gold looks south, having breached support at $1,850.
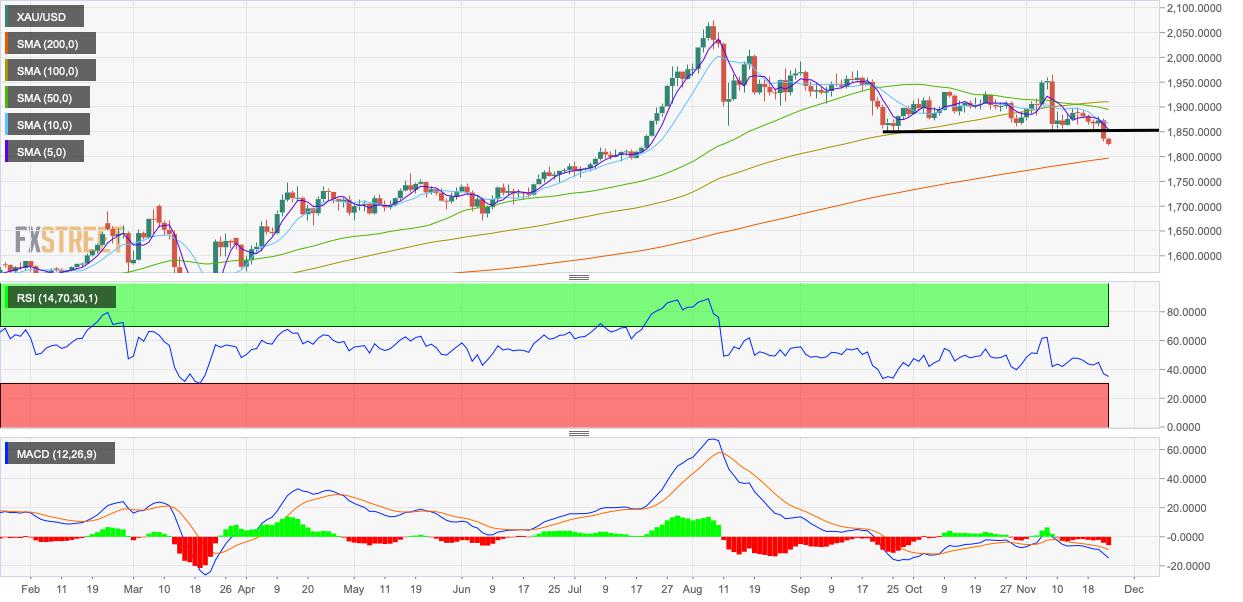
- The daily chart indicators favor a deeper drop to the 200-day SMA.
Having found acceptance under long-held support, gold now risks falling to the 200-day Simple Moving Average (SMA).
The yellow metal closed below $1,850 on Monday, violating the level, which acted as a strong floor multiple times since September.
The breakdown is backed by a below-50 or bearish reading on the 14-day Relative Strength Index (RSI) and a negative MACD histogram. The 5- and 10-day SMAs are trending south, indicating a bearish setup, and so is the bearish crossover of the 50- and 100-day SMAs.
As such, the long-term SMA of $1,796 could soon come into play. The yellow metal is currently trading at a four-month low of $1,824 per ounce, representing a 0.68% drop on the day.
Daily chart
Trend: Bearish
Technical levels
XAU/USD

Source: https://www.fxstreet.com/news/...
Disclaimer: The content above represents only the views of the author or guest. It does not represent any views or positions of FOLLOWME and does not mean that FOLLOWME agrees with its statement or description, nor does it constitute any investment advice. For all actions taken by visitors based on information provided by the FOLLOWME community, the community does not assume any form of liability unless otherwise expressly promised in writing.
FOLLOWME Trading Community Website: https://www.followme.com


Hot
No comment on record. Start new comment.