Daily Market Report - 18th Nov 2020


NCM Investment - The Festival of GOLD
OPEN ACCOUNT AND GET A CHANCE TO WIN GOLD
For more details: https://www.nooralmal.com/gold...
Official Website: https://www.nooralmal.com/
EURUSD
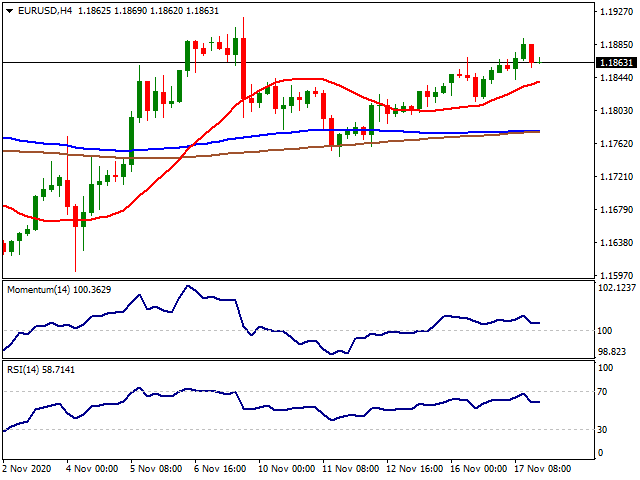
The EUR/USD pair hit a weekly high of 1.1893, losing momentum during US trading hours, to settle in the current 1.1860 price zone. The greenback moved alongside equities, falling on a dismal market mood and later recovering as Wall Street bounced from intraday lows. Investors were looking at the latest coronavirus developments in the US as the pandemic worsened in the country, forcing authorities to take restrictive measures.
Softer-than anticipated US macroeconomic data exacerbated the greenback’s weakness, as October Retail Sales rose a modest 0.3% in the month, missing expectations. The core reading came in at 0.1%, also much worse than anticipated. The country also published Import Prices and Export Prices for the same month, which contracted by more than anticipated. Industrial Production, however, improved by more than expected, up 1.1% in the month, while Capacity Utilization printed 72.8%. This Wednesday, the EU will release the final readings of October inflation, while the US will publish October Building Permits and Housing Starts for the same month.
The EUR/USD pair retains its positive bias but continues to lack momentum. The pair is trading at the upper end of its latest range, but there are no signs of an imminent breakout. The 4-hour chart shows that it keeps developing above all of its moving averages, with a bullish 20 SMA advancing below the larger ones but below the current level. Technical indicators have turned flat, still within positive levels, indicating buying interest recedes on approaches to the 1.1900 area.
Support levels: 1.1830 1.1790 1.1740
Resistance levels: 1.1885 1.1920 1.1965
USDJPY
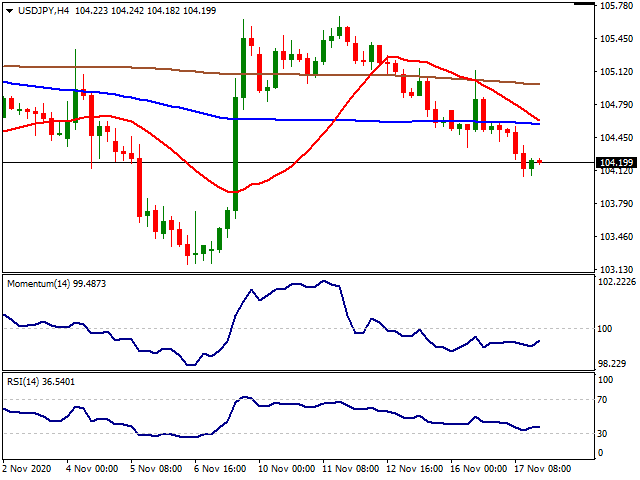
The USD/JPY pair traded as low as 104.06 this Tuesday, ending the American session trading around 104.20. The Japanese currency appreciated on a dismal market mood, accelerating its decline after the release of poor US Retail Sales figures. The pair bounced mid-American session, following the release of upbeat Industrial Production figures. However, USD/JPY held near daily lows, weighed by the poor performance of government debt yields. The yield on the benchmark 10-year Treasury note fell to 0.87%, a fresh weekly low.
The Japanese macroeconomic calendar had nothing to offer this Tuesday. The country will publish its October Merchandise Trade Balance, expected to post a surplus of ¥250 billion, below the previous ¥687.8 billion.
The USD/JPY pair is heading into the Asian session with a bearish bias. The 4-hour chart shows that it has fallen below all of its moving averages, with the 20 SMA heading firmly lower above the current level. In the meantime, technical indicators consolidate at daily lows, well into negative territory. The ongoing decline is expected to continue on a break below 103.95, towards the monthly low at 103.17.
Support levels: 103.95 103.50 103.15
Resistance levels: 104.30 104.75 105.20
GBPUSD
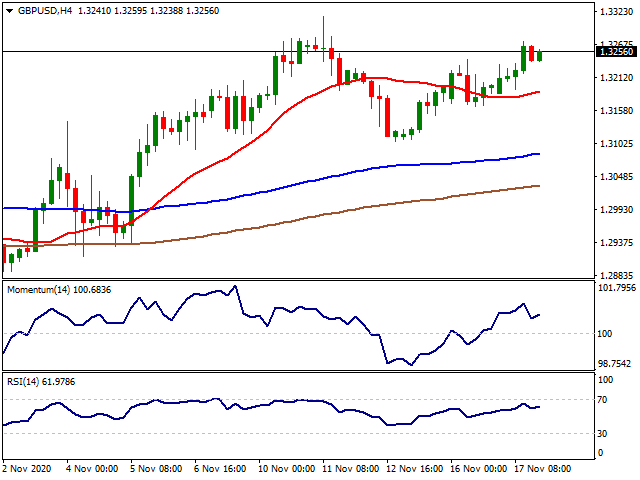
The GBP/USD pair got boosted by market talks hinting a trade deal between the UK and the EU might be around the corner. The pair hit a daily high of 1.3272, now trading in the 1.3250 price zone, further underpinned by the broad dollar’s weakness. Trade talks have resumed in Brussels, and the encouraging headlines over a breakthrough were partially overshadowed by the potential failure of negotiations, as the two sides are still away on key points. Ireland Prime Minister Micheal Martin said that the UK economy is not prepared for a no-deal Brexit.
This Wednesday, the UK is set to publish October inflation figures. The annual CPI is foreseen at 0.6% in October, after printing 0.5% in September. The monthly inflation, however, is expected to have fallen by 0.1%. Additionally, BOE’s Governor Andrew Bailey is scheduled to speak in a public event.
The GBP/USD pair has room to extend its advance, according to intraday technical readings. The 4-hour chart shows that technical indicators retreated from near overbought levels, but they remain well above their midlines, without clear directional strength. The 20 SMA aims modestly higher around 1.3190, while the larger ones maintain their bullish slopes below it. A substantial advance will be more likely on a break above 1.3313 this month´s high.
Support levels: 1.3210 1.3165 1.3120
Resistance levels: 1.3275 1.3320 1.3360
AUDUSD
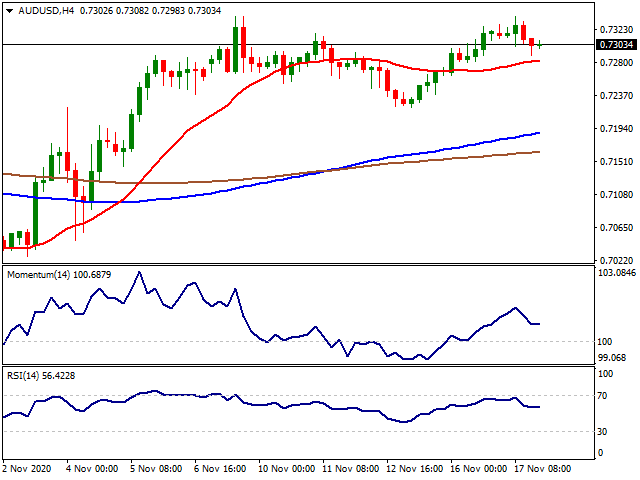
The AUD/USD pair advanced to 0.7339 this Tuesday, where it also topped earlier this month. Now trading around 0.7300, the Australian dollar was undermined by the soft tone of European and American indexes, although the latest ones managed to trim part of their intraday losses.
Early in Asia, the Reserve Bank of Australia published the Minutes of its latest meeting, which showed that the central bank is ready to provide more stimulus if needed after cutting rates to a record low of 0.1%. Policymakers repeated that they expect to keep the cash rate at the current level for the foreseeable future. RBA’s Governor Philip Lowe is scheduled to speak this Wednesday. The Australian calendar includes the October Westpac Leading Index and Q3 Wage Price Index data.
The AUD/USD pair retains its positive stance in the near-term but lacks a catalyst strong enough to push it higher. A possible double top is underway, that would be confirmed on a break below 0.7220. Meanwhile, the 4-hour chart shows that it keeps developing above a mildly bullish 20 SMA, while the larger moving averages keep advancing below it. Technical indicators corrected overbought conditions but stabilized well into positive territory, indicating limited selling interest.
Support levels: 0.7290 0.7250 0.7210
Resistance levels: 0.7345 0.7380 0.7420
GOLD
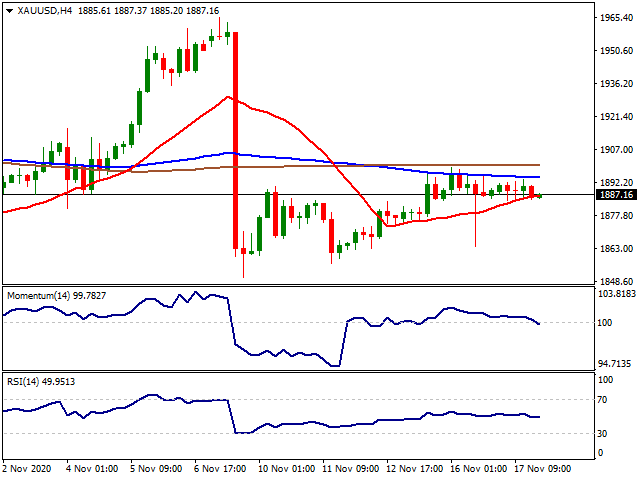
Gold failed to capitalise the ongoing retracement seen in the USD index DXY on Tuesday. The trading range was tight compared to previous sessions as markets are trying to digest the vaccine news still. While markets cheered the positive vaccine results and carried the indexes to their new all-time highs, it will still take some significant time until the vaccination reaches masses. The second wave of the pandemic forced Europe to go into partial lockdown while the US is heading towards the same situation as the number of new cases and casualties continues to surge. On the monetary side, Democrats win and the size of the stimulus package will set the fate of the USD in the coming term. On the other hand, the ECB is expected to announce a big easing package which might support USD against EUR. Therefore, Gold will most likely drift away from its expected rally as the decline in the USD might not be as big as projected by the markets.
From the technical point of view, below the $1,860 level, the supports can be followed at $1,763 ($1,451-$2,075 61.80%) and $1,700 levels. Over the $1,860 level, the resistances can be followed at $1,900 with $1,956 ($1,451-$2,075 38.20%) and $2,000 levels.
Support Levels: $1,860 $1,763 $1,700
Resistance Levels: $1,900 $1,956 $2,000
SILVER
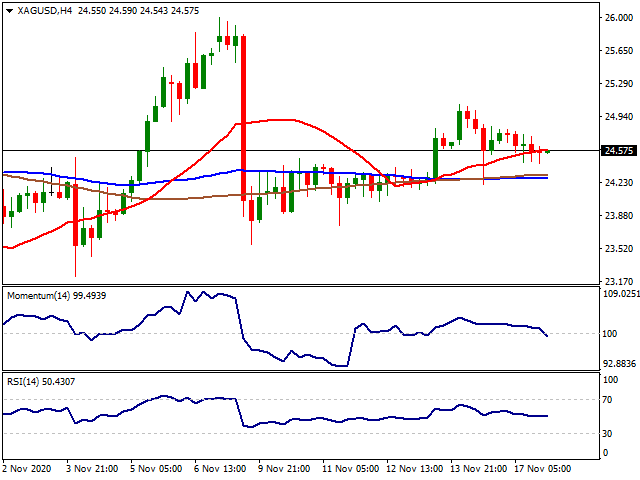
Silver also failed to benefit the decline seen in the USD index DXY on Tuesday. As the markets are trying to capitalise their recent gains, both risk instruments and safe havens retraced in tight market conditions. As Silver is stuck in limited range trading at the moment, physical demand data signals better pricing might be on the table in the coming term. Physical investment is expected to surge by 27% to 236.8 Moz in 2020, which would be a 5-year high. The largest retail market for bars and coins, the US, will lead the way with a projected 62% gain. This reflects the impact of increased price volatility and healthy price expectations. The second-largest market, India, however, has experienced a markedly weaker second half, with outright liquidations, resulting in an estimated 20% decline for the full-year total. Silver printed 38% YoY basis compared to Gold’s 24% YoY so far which makes it a better investment tool so far.
Below the $22.90 level ($11.63-$29.86 38.20%), the supports can be followed at $20.75 ($11.63-$29.86 50.00%) and $18.42 ($11.63-$29.86 61.80%). Over the $22.90 level, the target's up can be followed at $25.21 ($11.63-$29.86 23.60%), $26.00 (August-September support), $27.00 and $28.00 levels.
Support Levels: $22.90 $20.75 $18.42
Resistance Levels: $25.21 $26.00 $27.00
DOW JONES
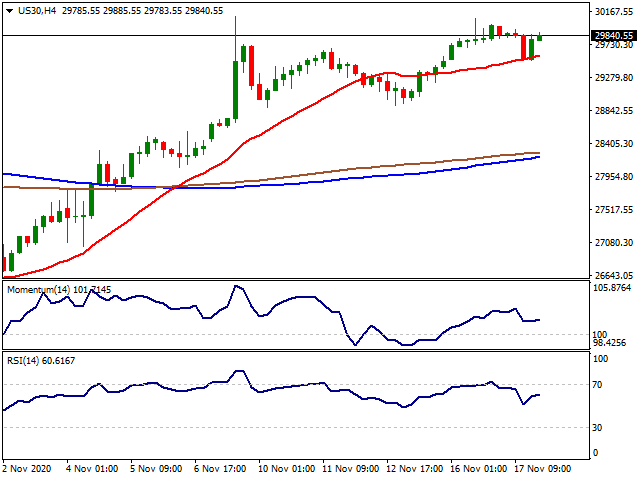
After the previous day’s rally, Dow Jones faced a technical correction on Tuesday. Industrial production rebounded in October, rising by 1.1%, slightly above the 1.0% expected in the US while the latest lockdown measures were mostly service sector related. Also, the NAHB/Wells Fargo homebuilders’ index rose five points to 90 in November. The present sales index leapt six points to an astonishing 96 while future sales inched up one point to 89 and prospective buyer traffic rose three points to 77. On the other hand, Retail Sales in the US rose by 0.3% on a monthly basis in October to $553.3 billion, the data published by the US Census Bureau showed on Tuesday. This reading followed September's increase of 1.6% (revised from 1.9%) and missed the market expectation of 0.5% indicating the effects of newly imposed lockdown measures. Markets seem to drift away from the election dynamics in the US at the moment as the pandemic again becomes the main driver for the markets. On Tuesday, Fang Xinghai, Vice-Chairman of the China Securities Regulatory Commission (CSRC), said in a statement that US President-elect Joe Biden offers an opportunity for better China-US relations signalling a normalisation between the world’s two largest economies.
From the technical point of view, if the index stays over 29,000, 29,500 and 30,000 levels can be followed as new targets high while below the 28,400 level, 28,000 and 27,770 can be followed as supports.
Support Levels: 28,400 28,000 27,770
Resistance Levels: 29,500 30,000 30,500
WTIOIL
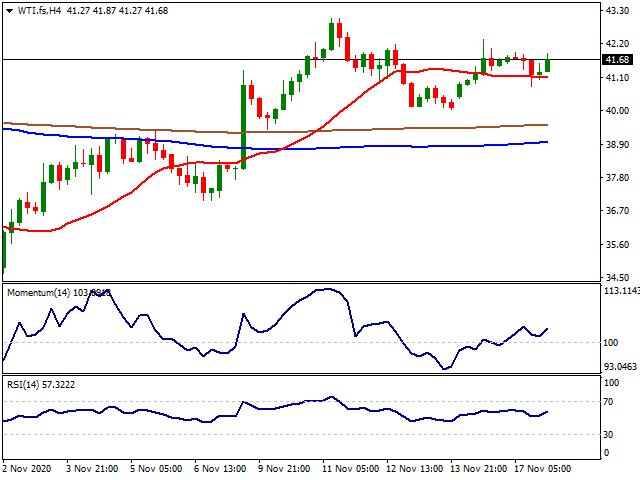
WTI also had an indecisive trading session on Tuesday. In general, both risk assets and safe havens faced a technical correction downside as markets are trying to digest the positive developments regarding the coronavirus vaccine. While vaccine news created a positive mood in the markets, fears of tighter restrictions before the public use of the treatment are limiting the gains of WTI at the moment. Also as the majority of the producer countries supporting an extension of the output cuts beyond January, a decision is yet to be announced due November 30th at the OPEC+ meeting. However, this expectation also failed to move WTI further at the moment.
If WTI manages to hold over $40.56 ($65.62-$0.00 61.80%) level, the target's upside can be followed at $41.00, $46.57 (March decline start) and $50.00 levels. Below $40.00, the supports can be followed at $39.00 and $32.81 ($65.62-$0.00 50.00%) and $31.00 levels.
Support Levels: $39.00 $32.81 $31.00
Resistance Levels: $41.00 $46.57 $50.00
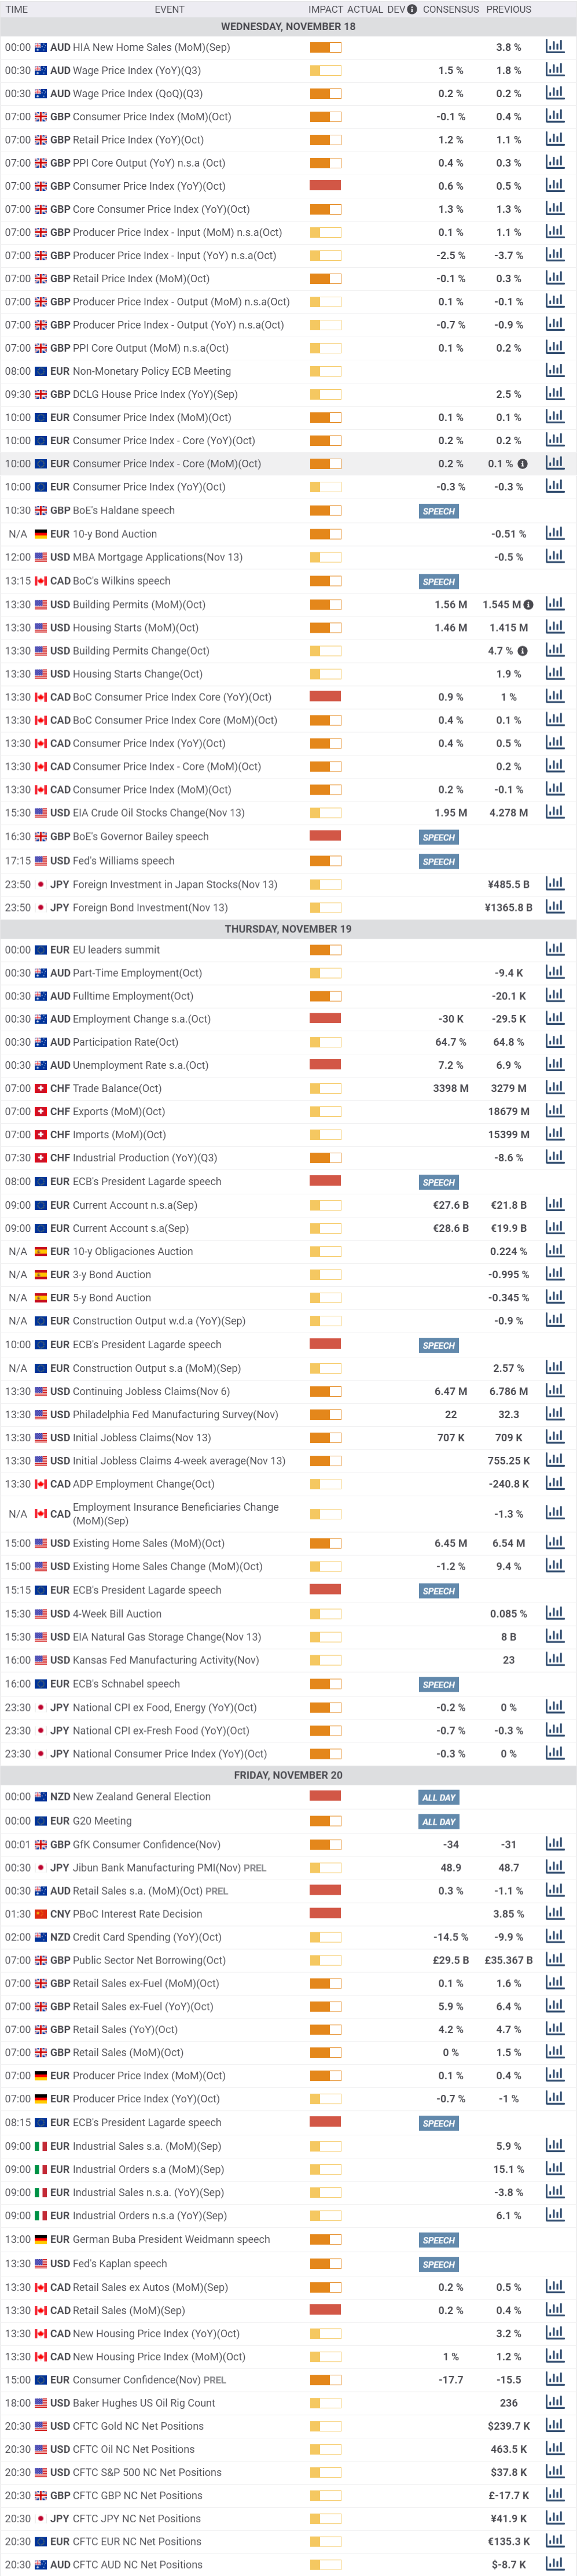
MACROECONOMIC EVENTS
* All the Moving Average support and resistance levels are dynamic by nature. Means when the price approaches the Moving averages, slight variation occurs in the forecasted Moving Average support and resistance levels. Previous few days’ intraday levels are also signicant while trading the current day as the price tend to hover around these levels for some time. Levels in red indicate strong, critical or vital.
Please remember that trading financial markets carry a high degree of risk to your capital. It is possible to lose more than your initial stake. Leveraged products may not be suitable for all investors, therefore please ensure you fully understand the risks involved and seek independent advice if necessary.
All Rights Reserved © Noor Al Mal
Disclaimer: The content above represents only the views of the author or guest. It does not represent any views or positions of FOLLOWME and does not mean that FOLLOWME agrees with its statement or description, nor does it constitute any investment advice. For all actions taken by visitors based on information provided by the FOLLOWME community, the community does not assume any form of liability unless otherwise expressly promised in writing.
FOLLOWME Trading Community Website: https://www.followme.com


Hot
No comment on record. Start new comment.