Daily Market Report - 15th Oct 2020


For more details: https://www.nooralmal.com/
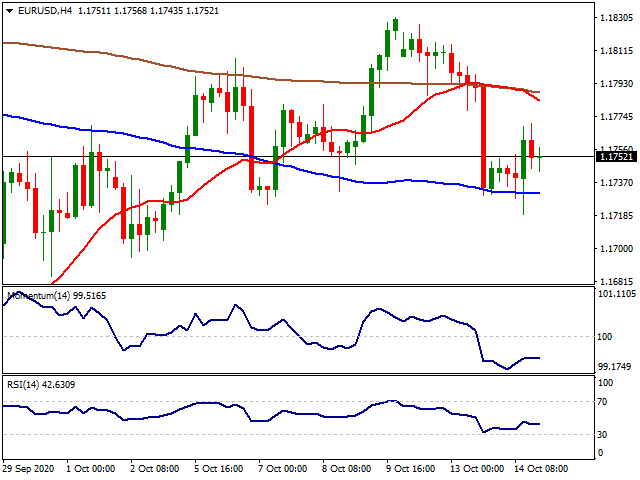
EURUSD
The EUR/USD pair traded as high as 1.1770 this Wednesday, underpinned by a mild optimism that prevailed for most of the day, amid relief coming from the Brexit front. Half-way the US session, Wall Street suffered a major setback and plunged into the red, as US Treasury Secretary Steven Mnuchin said that stimulus talks with democrats are still far apart on certain issues, and that getting something done before the election seems difficult. The dollar recovered some ground but remained in the red against most major rivals.
Earlier in the day, the EU published August Industrial Production, which rose 0.7% in the month and declined by 7.2% when compared to a year earlier. As for the US, it published the September Producer Price Index, which was up 0.4% when compared to a year earlier, doubling expectations and improving from -0.2%. The core PPI surged to 1.2% YoY, beating expectations. The macroeconomic calendar will remain light this Thursday, with the most relevant event being US Initial Jobless Claims for the week ended October 9, foreseen at 825K.
The EUR/USD pair is trading around 1.1750, pretty much unchanged on a daily basis. The bullish potential seems limited, as the pair failed to extend its advance beyond a mildly relevant resistance. From a technical perspective, the 4-hour chart shows that it is trading above a bearish 100 SMA, but below the 20 and 200 SMAs. Technical indicators hold within negative levels, with modest bearish slopes that skew the risk to the downside.
Support levels: 1.1720 1.1680 1.1635
Resistance levels: 1.1770 1.1810 1.1850
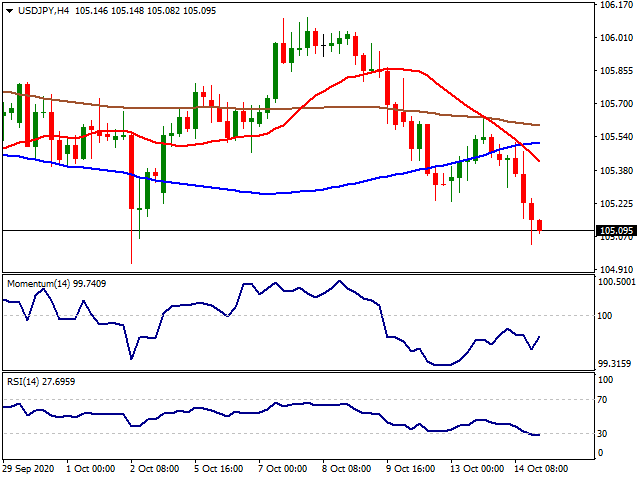
USDJPY
The USD/JPY pair edged lower in the latest US session, falling to 105.03 and finishing the day a handful of pips above this last. The slump followed a similar behavior in Wall Street, triggered by news indicating that a possible US coronavirus aid package wouldn’t be likely before the presidential election. US Treasury yields, in the meantime, remain near weekly lows although they saw little action throughout the day.
Japanese data published at the beginning of the day was disappointing, as Industrial Production rose 1% MoM in August, below the 1.7% expected. Yearly basis, Industrial Production fell 13.8%. Capacity Utilization in the same period, rose 2.9% missing the expected 3.6%. This Thursday, the country will publish the August Tertiary Industry Index, previously at -0.5%.
The USD/JPY pair is technically bearish, trading at fresh weekly lows and poised to extend its decline. The 4-hour chart shows that it´s developing below all of its moving averages, with the 20 SMA heading firmly lower below the larger ones. The Momentum indicator aims to recover within negative levels, but the RSI keeps heading south around 30, supporting a bearish continuation in the near-term.
Support levels: 105.00 104.65 104.20
Resistance levels: 105.80 106.25 106.60
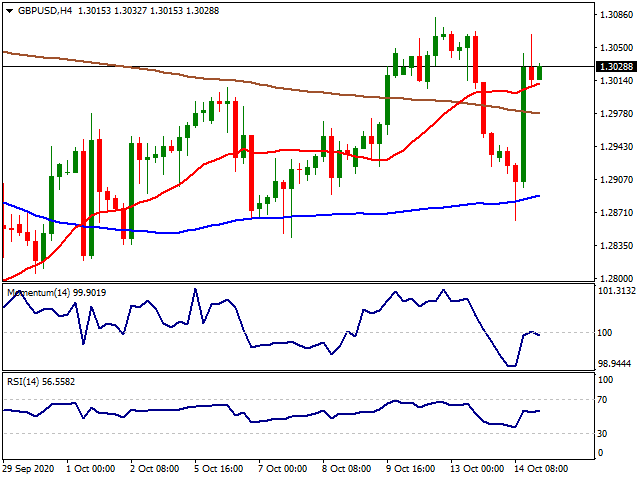
GBPUSD
The GBP/USD pair recovered from a fresh weekly low of 1.2862 to a daily high of 1.3064, backed by headlines indicating that the UK government will allow Brexit talks to extend beyond the former deadline announced by PM Boris Johnson on October 15. The pair retreated from such high following comments from US Treasury Secretary Mnuchin, as he cooled hopes for a stimulus package before the presidential election. Nevertheless, the pair retained the 1.3000 level.
Meanwhile, the UK reported almost 20,000 new coronavirus cases on Wednesday. PM Johnson spoke on the issue and mentioned that a regional approach is the right way forward, adding that the aim is to avoid a national lockdown. At this point, Brexit headlines will likely overshadow coronavirus-related ones. The UK macroeconomic calendar had nothing interesting to offer this Thursday.
The GBP/USD pair trades around 1.3030 trimming its previous weekly losses. Despite it’s sharply up daily basis, the short-term picture is neutral-to-positive. In the 4-hour chart, the pair settled a few pips above a mild-bullish 20 SMA, although technical indicators turned flat around their midlines. Further gains are to be expected on a break above 1.3065, the immediate resistance, eyeing an extension beyond the 1.3100 figure.
Support levels: 1.2995 1.2950 1.2905
Resistance levels: 1.3065 1.3100 1.3140
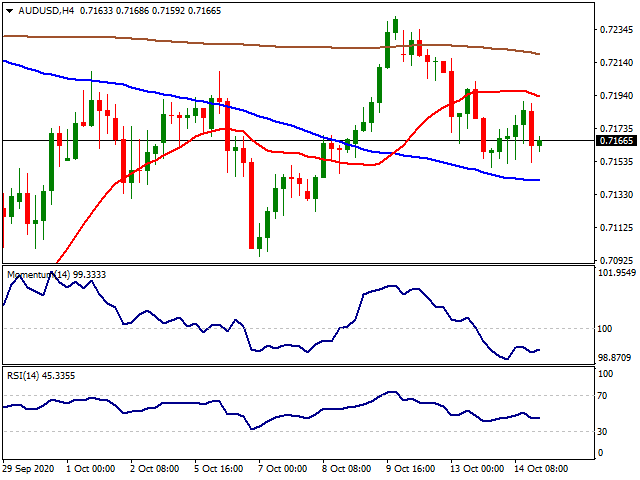
AUDUSD
The AUD/USD pair is ending the day as it started around 0.7160, having spent it within a well-limited range. The pair advanced to 0.7190, but it changed course with Wall Street’s slump mid-US session. The Aussie remained subdued, despite Westpac Consumer Confidence resulted in 11.9% in October, better than the 9.9% forecast, although below the previous 18%.
This Thursday Australia will publish its September employment figures. The country is expected to have lost 35,000 jobs in the month, while the unemployment rate is seen at 7.1%, up from 6.8% in August. Additionally, China will publish September inflation figures, with the CPI foreseen at 1.8% YoY.
The AUD/USD pair maintains its bearish stance in the short-term, although the upcoming direction will likely be dictated by the outcome of the employment report. The 4-hour chart shows that it keeps trading below its 20 SMA while above a bearish 100 SMA. Technical indicators have stabilized within negative levels, skewing the risk to the downside without confirming further declines ahead.
Support levels: 0.7130 0.7095 0.7050
Resistance levels: 0.7205 0.7240 0.7290
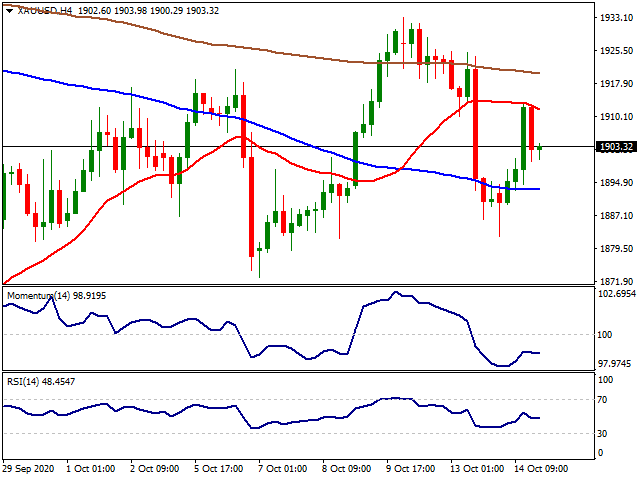
GOLD
After two consecutive sessions with a decline, Gold managed to re-gain the physiological level of $1,900. Mixed reports on the stimulus deal in the US is mainly driving the risk sentiment still. US Treasury Secretary Mnuchin said on Wednesday that it was not going to be easy to reach a deal with Democrats before the presidential election despite the fact that they have been making progress on certain issues. On the other hand, especially the EU countries started to re-impose countermeasures against the Covid-19 pandemic as the number of new cases started to incline at a fast pace. Markets are in a wait and see mode at the moment as the USD index DXY is hovering around mid-93.00 levels while the US indexes faced a technical correction down.
Below the $1,860 level, the supports can be followed at $1,763 ($1,451-$2,075 61.80%) and $1,700 levels. Over the $1,860 level, the resistances can be followed at $1,900 with $1,956 ($1,451-$2,075 38.20%) and $2,000 levels.
Support Levels: $1,860 $1,763 $1,700
Resistance Levels: $1,900 $1,956 $2,000
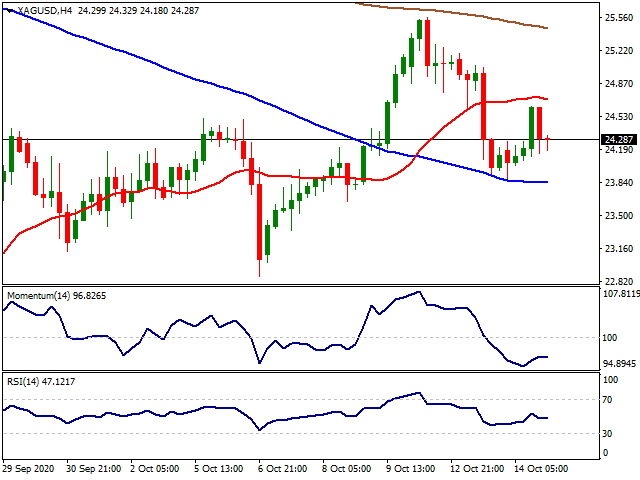
SILVER
Silver also rebounded on Wednesday trading as the USD index DXY slightly retraced back. The current cautious mood is causing volatile trading sessions as there is a strong possibility that the election result in the US will take much longer to be clear and stimulus deals will be delayed further. Also, re-impose of lockdown measures in the EU combined with vaccine trials pause pressuring the markets at the moment. On the other hand, current monetary conditions are in favour of precious metals. Therefore, retracements seen in silver might give investors to expand their portfolios for the long run.
Below the $22.90 level ($11.63-$29.86 38.20%), the supports can be followed at $20.75 ($11.63-$29.86 50.00%) and $18.42 ($11.63-$29.86 61.80%). Over the $22.90 level, the targets up can be followed at $25.21 ($11.63-$29.86 23.60%), $26.00 (August-September support), $27.00 and $28.00 levels.
Support Levels: $22.90 $20.75 $18.42
Resistance Levels: $25.21 $26.00 $27.00
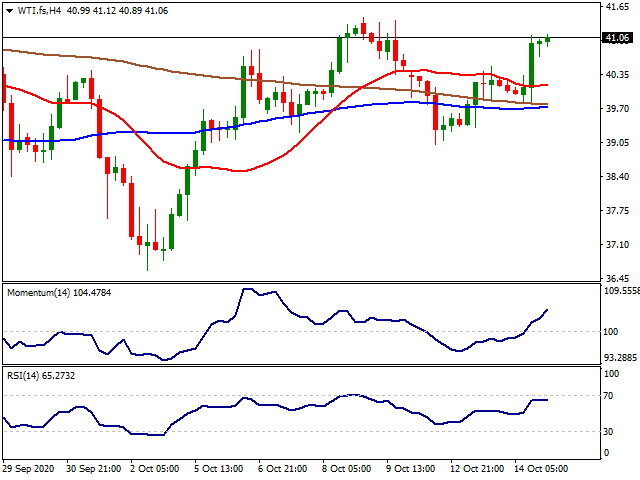
CRUDE WTI
WTI extended its bullish run on Wednesday supported by the solid demand from China and the possibility of a modification of tapering from OPEC+. Crude oil imports in China rose 17.6% y/y to 48.5mt while OPEC+ signalling a willingness to revise their planned tapering of the historic output deal. On the other hand, the increasing number of cases in the EU sparked demand fears limiting the incline seen in WTI. Also, due to the International Energy Agency (IEA), a vaccine and therapeutics could mean the global economy to rebound in 2021 and energy demand to recover by 2023 with global energy demand falling by 5% in 2020, CO2 emissions related to energy by 7% and energy investment by 18%.
If WTI manages to hold over $40.56 ($65.62-$0.00 61.80%) level, the targets upside can be followed at $41.00, $46.57 (March decline start) and $50.00 levels. Below $40.00, the supports can be followed at $39.00 and $32.81 ($65.62-$0.00 50.00%) and $31.00 levels.
Support Levels: $39.00 $32.81 $31.00
Resistance Levels: $41.00 $46.57 $50.00
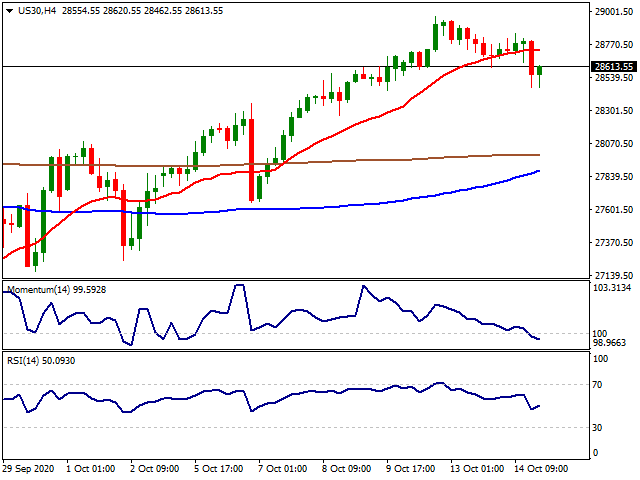
DOW JONES
Global markets once again stayed under pressure as a rising number of new cases in the EU forced governments to re-implement lockdown measures. France declared a public health state of emergency while Italy, Russia and Poland reported their highest-ever daily number of new cases. Also, a pause in vaccine trials due to unexpected side effects sparked the risk-off mood earlier in the week. On the other hand, despite the progress made in some points, US Treasury Secretary Mnuchin said on Wednesday that it was not going to be easy to reach a deal with Democrats before the presidential election. Apart from the usual risk events, Bank of America and Wells Fargo also disappointed investors with their quarterly results.
From the technical point of view, over the physiological 28,000 level, 28,400 with 29,000 and 29,500 can be followed as next resistance while below 27,770 level the supports can be seen at 27,400, with 27,000 and 26,757 (24,680-27,400 23.60%) levels.
Support Levels: 27,700 27,400 27,000
Resistance Levels: 28,400 29,000 29,500
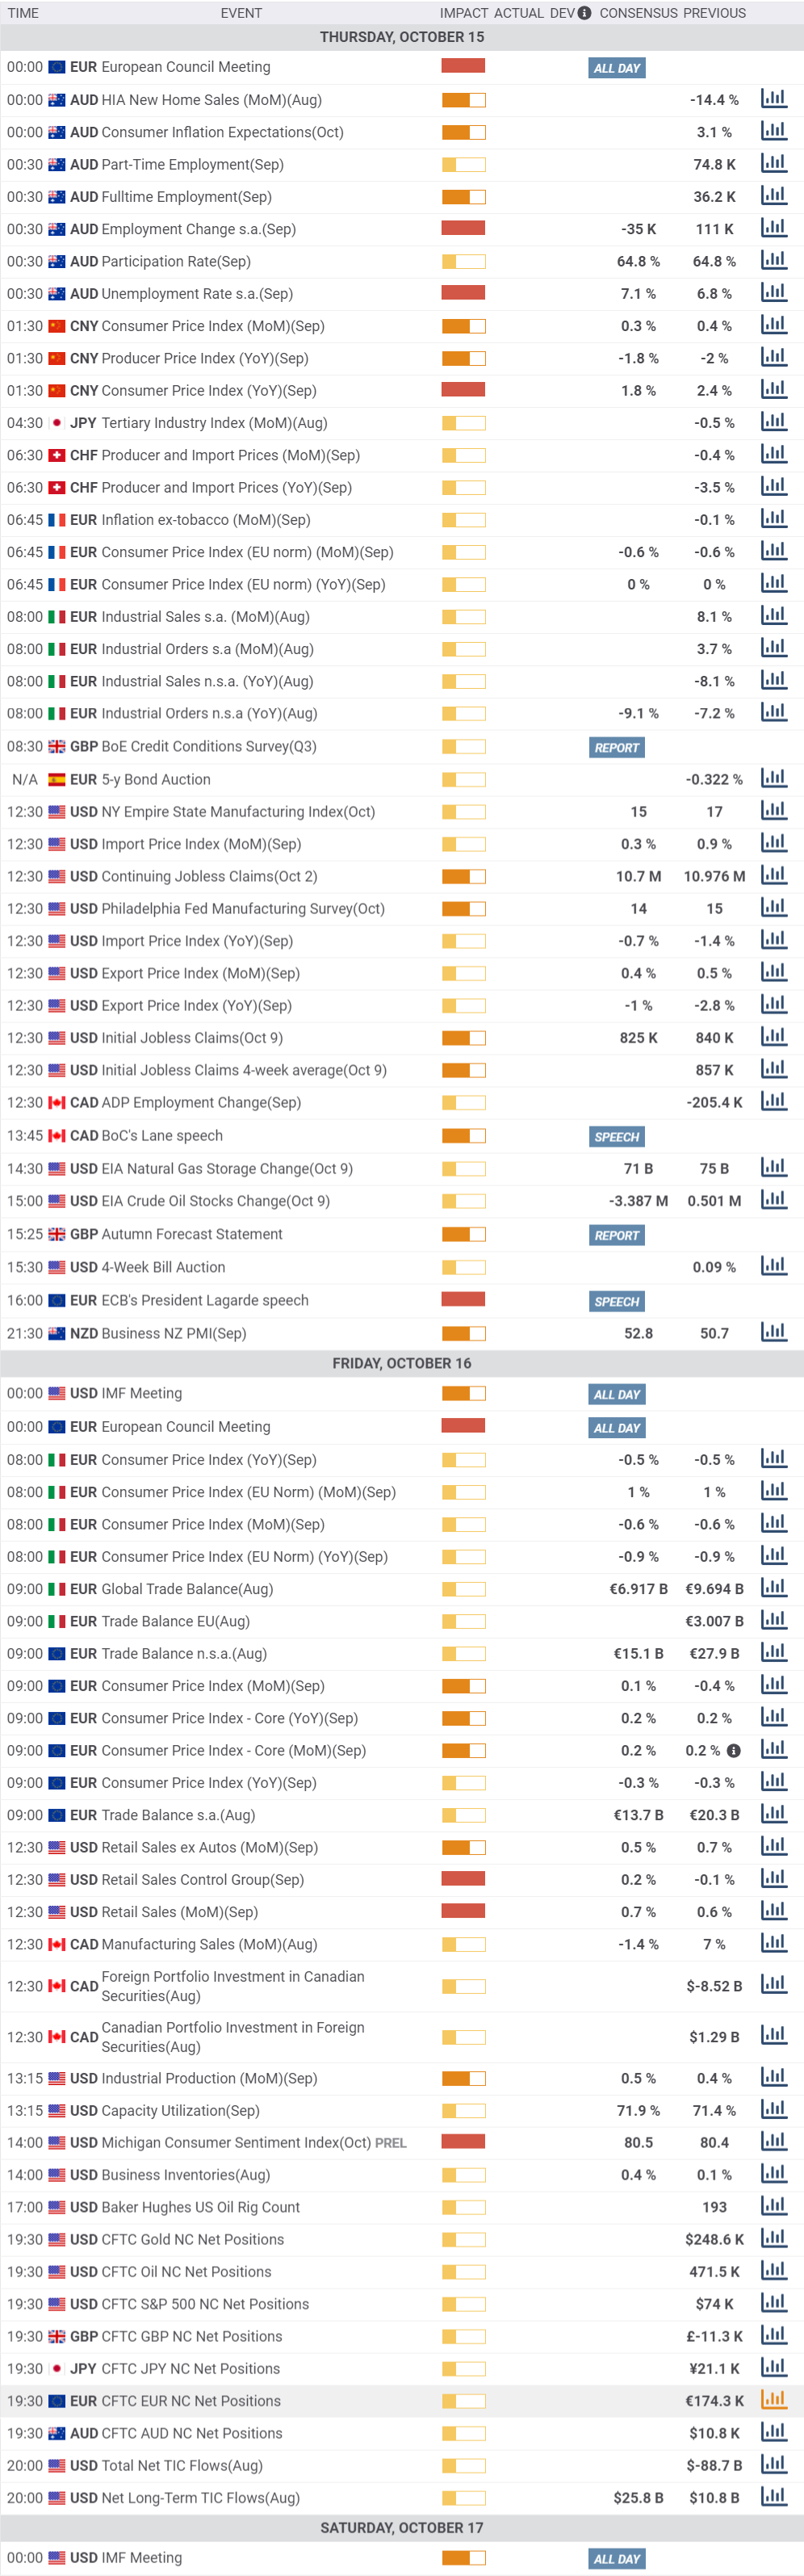
MACROECONOMIC EVENTS
* All the Moving Average support and resistance levels are dynamic by nature. Means when the price approaches the Moving averages, slight variation occurs in the forecasted Moving Average support and resistance levels. Previous few days’ intraday levels are also signicant while trading the current day as the price tend to hover around these levels for some time. Levels in red indicate strong, critical or vital.
Please remember that trading financial markets carry a high degree of risk to your capital. It is possible to lose more than your initial stake. Leveraged products may not be suitable for all investors, therefore please ensure you fully understand the risks involved and seek independent advice if necessary.
All Rights Reserved © Noor Al Mal
#脱欧谈判陷僵局##ImTrader交易大赛##庆祝深圳特区40周年##2020年美国大选##9月非农爆冷下滑#
Disclaimer: The content above represents only the views of the author or guest. It does not represent any views or positions of FOLLOWME and does not mean that FOLLOWME agrees with its statement or description, nor does it constitute any investment advice. For all actions taken by visitors based on information provided by the FOLLOWME community, the community does not assume any form of liability unless otherwise expressly promised in writing.
FOLLOWME Trading Community Website: https://www.followme.com


Hot
No comment on record. Start new comment.