Gold Price Recoil From Chart Resistance As The US Dollar Strengthens.

Gold prices have entered a period of consolidation since coming off the all-time high (US$ 2,075) in early August. Recently, gold seemed to have found strong support at US$ 1,870 (the 76.4% Fibonacci retracement) and has since rebounded, entering into an “Ascending Channel” as highlighted in the chart below.
Technically, gold prices have formed a few bearish harmonic pullbacks (highlighted in black straight lines) from early August to the end of September, with downward pressure prevailing. Immediate resistance levels could be found at US$ 1,930 (50-Day SMA), followed by US$ 1,942 (50% Fibonacci retracement) and then US$ 1,973 (38.2% Fibonacci retracement). Breaking above this resistance could clear the way for further upside and confirm a medium-term trend reversal.
As gold prices remain in the channel, the near-term momentum appears biased towards the upside. Immediate support levels could be found at US$ 1,910 and then US$ 1,895 – where the channel’s lower bound and the 100-Day SMA are found.
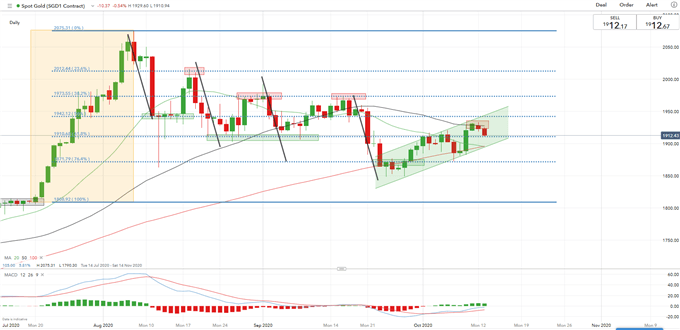
Photo: Gold Price – Daily Chart (Bloomberg, DailyFX)
In the absence of geopolitical catalysts, gold prices may continue to follow the direction of the US Dollar (DXY) and drift alongside risk sentiment. The inverse correlation between gold prices and DXY can be seen on the chart below.
A drastic swing in risk appetite on Tuesday led a rebound in the US Dollar, which simultaneously weighed on precious metal prices. Asia-Pacific stocks erased earlier gains at mid-day trading. Chinese balance of trade data came in at $37 billion, falling short of a $58 billion estimate due to an unexpected surge in imports.
Similarly, silver prices have retraced from a three-week high to test an immediate support at US$ 24.58 – the 50% Fibonacci retracement.
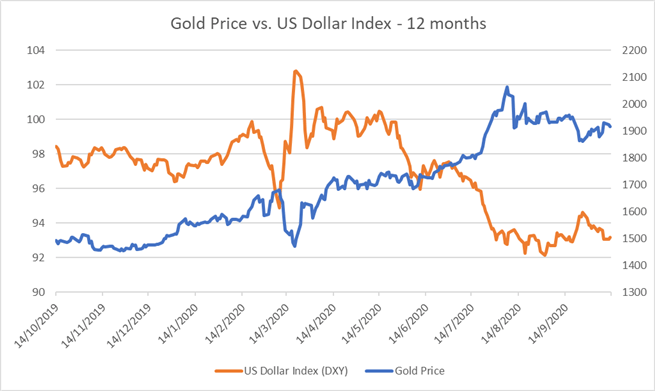
Photo: Gold Prices vs. US Dollar Index – Past 12 Months (Bloomberg, DailyFX)
From a longer-term perspective, however, gold prices are still supported by the overall macro environment (ultra-low interest rates) and ample liquidity conditions, even as short-term consolidation is underway.
IG Client Sentiment indicates that gold traders are heavily leaning towards the long side, with 74% of positions net long, while 23% are net short (chart below). As gold prices have consolidated, retail traders have added both long (+7%) and short (+4%) positions overnight. Compared to a week ago, traders have added to long (+3%) while reducing short (-9%) exposure.
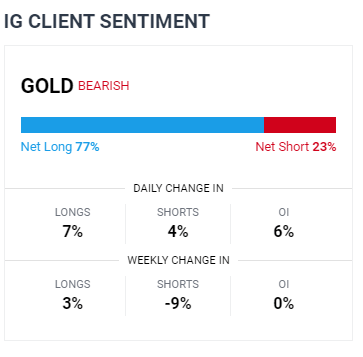
Photo: IG Client Sentiment (Bloomberg, DailyFX)
Reprinted from https://www.dailyfx.com/forex/..., the copyright all reserved by the original author.
Disclaimer: The content above represents only the views of the author or guest. It does not represent any views or positions of FOLLOWME and does not mean that FOLLOWME agrees with its statement or description, nor does it constitute any investment advice. For all actions taken by visitors based on information provided by the FOLLOWME community, the community does not assume any form of liability unless otherwise expressly promised in writing.
FOLLOWME Trading Community Website: https://www.followme.com


Hot
-THE END-