Gold Price Futures (GC) Technical Analysis – Trend Changes to Up on Trade Through $1927.00

Gold futures are up over 1% on Friday due to a weaker U.S. Dollar and was headed for a second straight weekly gain, with the metal’s appeal as an inflation hedge bolstered by renewed optimism over a new U.S. coronavirus relief package.
At 08:12 GMT, December Comex gold is trading $1919.00, up $23.90 or +1.26%.
Negotiations resumed between House Speaker Nancy Pelosi and Treasury Secretary Steven Mnuchin over the coronavirus aid plan. Additionally, a widening lead for Democratic presidential candidate Joe Biden was also seen as opening the way for big economic stimulus.
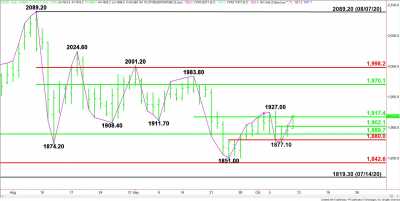
Daily December Comex Gold
Daily Swing Chart Technical Analysis
The main trend is down according to the daily swing chart. A trade through $1927.00 will change the main trend to up. A move through $1877.10 will signal a resumption of the downtrend.
On the downside, the support is a minor 50% level at $1902.10, a main 50% level at $1889.70 and a Fibonacci level at $1880.00.
The minor range is $1983.80 to $1851.00. Gold is currently testing its 50% level at $1917.40. This level will likely control the direction of the market today.
The short-term range is $2089.20 to $1851.00. Its retracement zone at $1970.10 to $1998.20 is the primary upside target.
Daily Swing Chart Technical Forecast
Based on the early price action, the direction of the December Comex gold futures market on Friday is likely to be determined by trader reaction to $1917.40.
Bullish Scenario
A sustained move over $1917.40 will indicate the presence of buyers. The next target is the main top at $1927.00. Taking out this level will change the main trend to up. This could trigger an acceleration to the upside with the next target zone $1970.10 to $1998.20. Inside this zone is the main top at $1983.80, making it a valid upside target also.
Bearish Scenario
A sustained move under $1917.40 will signal the presence of sellers. This could lead to a labored break with potential downside targets coming in at $1902.10, $1889.70, $1880.00 and a main bottom at $1877.10. The latter is a potential trigger point for an acceleration to the downside. #gold##FX#
Reprinted from Fxempire,the copyright all reserved by the original author.
Disclaimer: The content above represents only the views of the author or guest. It does not represent any views or positions of FOLLOWME and does not mean that FOLLOWME agrees with its statement or description, nor does it constitute any investment advice. For all actions taken by visitors based on information provided by the FOLLOWME community, the community does not assume any form of liability unless otherwise expressly promised in writing.
FOLLOWME Trading Community Website: https://www.followme.com


Hot
No comment on record. Start new comment.