ETH/USD Bearish Pressure Prepares for Push Lower to Fib Targets

Price Charts and Technical Analysis
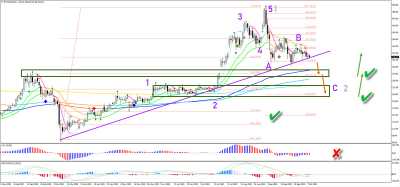
The ETH/USD is unable to break back above the 21 ema zone, which is a bad sign for the bulls. The previous uptrend was strong but the bears are likely to push price action below the long-term support trend line (purple). A breakout below that line and the previous bottom favours a further drop towards the next two support zones (green boxes). The first support zone is a confluence with the previous top, -27.2% Fibonacci target and the 50% Fibonacci level. The second support zone is the previous sideways zone, the -61.8% Fibonacci target and the 61.8% Fibonacci retracement level.
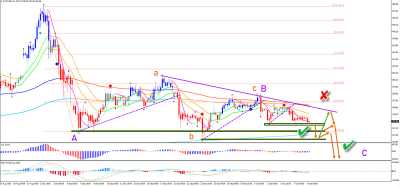
The bearish pressure is even more visible on the 4 hour chart. The red candles from our EW software confirm bearishness and price action is now clearly below the long-term moving averages. A break and pullback followed by another break lower is expected (see arrows). The wave patterns suggest a bearish ABC (purple) pattern. The ABC could complete a wave 1-2 (grey) on the daily chart.
Price Charts and Technical Analysis
The ETH/USD is unable to break back above the 21 ema zone, which is a bad sign for the bulls. The previous uptrend was strong but the bears are likely to push price action below the long-term support trend line (purple). A breakout below that line and the previous bottom favours a further drop towards the next two support zones (green boxes). The first support zone is a confluence with the previous top, -27.2% Fibonacci target and the 50% Fibonacci level. The second support zone is the previous sideways zone, the -61.8% Fibonacci target and the 61.8% Fibonacci retracement level.
The bearish pressure is even more visible on the 4 hour chart. The red candles from our EW software confirm bearishness and price action is now clearly below the long-term moving averages. A break and pullback followed by another break lower is expected (see arrows). The wave patterns suggest a bearish ABC (purple) pattern. The ABC could complete a wave 1-2 (grey) on the daily chart.
Reprinted from Fxempire,the copyright all reserved by the original author.
Disclaimer: The content above represents only the views of the author or guest. It does not represent any views or positions of FOLLOWME and does not mean that FOLLOWME agrees with its statement or description, nor does it constitute any investment advice. For all actions taken by visitors based on information provided by the FOLLOWME community, the community does not assume any form of liability unless otherwise expressly promised in writing.
FOLLOWME Trading Community Website: https://www.followme.com


Hot
No comment on record. Start new comment.