USD/JPY Forex Technical Analysis – Straddling Key Retracement Zone at 105.526 to 105.885

The USD/JPY retreated from an eight-day on Monday as U.S. equity indexes rallied after four straight weeks of declines ahead of a busy week of economic data and political developments in the United States.
The rebound in the stock market helped dampen the safe-haven appeal of the U.S. Dollar, but it remained underpinned by signs of a slowdown in the economic recovery from the pandemic and political uncertainties.
On Monday, the USD/JPY settled at 105.507, down 0.050 or -0.05%.
Worries abound that the economic recovery is stalling as many stimulus programs have expired, curbing consumer spending. This week, the major economic reports – ISM US Manufacturing PMI and Non-Farm Payrolls – come out late in the week on Thursday and Friday, respectively. However, investor attention will now turn to the first U.S. presidential debate on Tuesday.
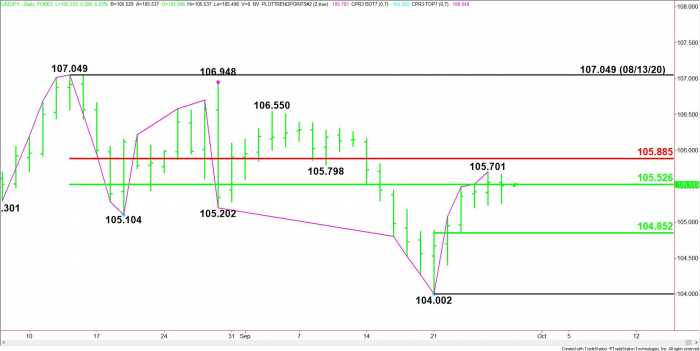
Daily USD/JPY
Daily Swing Chart Technical Analysis
The main trend is up according to the daily swing chart, however, momentum has been trending higher since the formation of the closing price reversal bottom on September 21. The main trend will change to up on a trade through 107.049. A move through 104.002 will negate the closing price reversal bottom and signal a resumption of the downtrend.
The short-term range is 107.049 to 104.002. Its retracement zone at 105.526 to 105.885 is currently being tested. This zone is controlling the near-term direction of the USD/JPY.
The minor range is 104.002 to 105.701. If the USD/JPY is rejected at 105.526 to 105.701 then look for a pullback into its 50% level at 104.852.
Short-Term Outlook
Based on the price action the last three days, the direction of the USD/JPY on Tuesday is likely to be determined by trader reaction to the main 50% level at 105.526.
Bullish Scenario
A sustained move over 105.526 will indicate the presence of buyers. The first upside target is last week’s high at 105.701, followed by the main Fibonacci level at 105.885. Sellers could come in on the first test of this level, but taking it out with conviction could trigger an acceleration to the upside with targets at 106.550 and 107.049.
Bearish Scenario
A sustained move under 105.562 will signal the presence of sellers. This could trigger the start of a sharp break into the minor pivot at 104.852. #USD/JPY##FX#
Reprinted from Fxempire,the copyright all reserved by the original author.
Disclaimer: The content above represents only the views of the author or guest. It does not represent any views or positions of FOLLOWME and does not mean that FOLLOWME agrees with its statement or description, nor does it constitute any investment advice. For all actions taken by visitors based on information provided by the FOLLOWME community, the community does not assume any form of liability unless otherwise expressly promised in writing.
FOLLOWME Trading Community Website: https://www.followme.com


Hot
-THE END-