Daily Market Report - 21st Sep 2020


$50 Free Margin Account Campaign:
https://www.nooralmal.com/cc19...
EURUSD
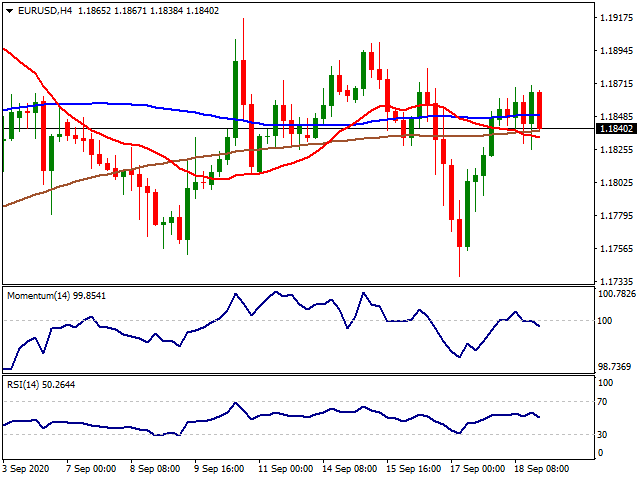
The EUR/USD pair closed a second consecutive week unchanged around 1.1840, as the dollar got to appreciate ahead of the close on upbeat US data combined with risk-off. The US published on Friday the preliminary estimate of the Michigan Consumer Sentiment Index, which improved in September to 78.9 from 74.1 in August. Meanwhile, US indexes fell for a third consecutive week, led by the tech-shares sell-off
Concerns gyrated around the absence of a coronavirus aid package, and renewed tensions between the US and China, after Washington ordered Google and Apple to remove TikTok and We-Chat from their platforms as of Sunday. Over the weekend, however, Secretary of Commerce Wilbur Ross announced a one-week delay until September 27, amid a developing deal between the Chinese company and Oracle. Sluggish global growth amid the ongoing pandemic adds to the gloomy picture. The market’s sentiment will keep on leading financial markets these days as the macroeconomic calendar won’t include first-tier data.
The EUR/USD pair is neutral according to the daily chart, as it spent the week around a directionless 20 DMA, although the larger ones keep heading north far below it. The Momentum indicator turned marginally lower around its midline while the RSI indicator stands flat around 54. In the short-term, and according to the 4-hour chart, the technical picture is neutral-to-bearish, with the pair trapped around congesting moving averages and indicators turning lower around their midlines.
Support levels: 1.1795 1.1750 1.1710
Resistance levels: 1.1880 1.1915 1.1950
USDJPY
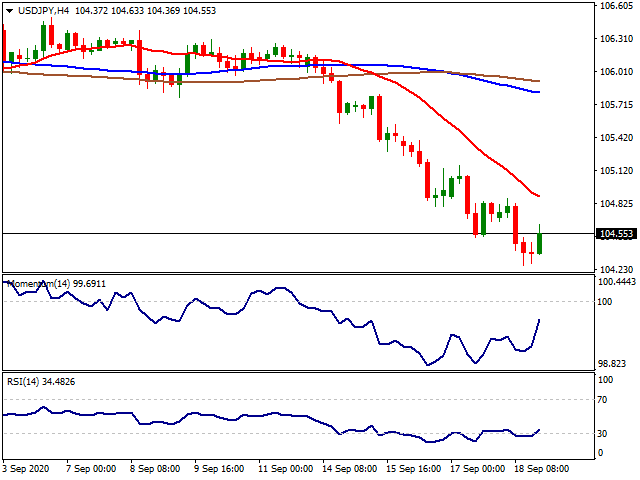
The USD/JPY plummeted this week to 104.26, flirting with July’s monthly low, to settle in the 104.50 price zone. The broad dollar’s weakness and an uneventful Federal Reserve kept the pair on the bearish path, with the decline exacerbated by the sour tone of equities. On Friday, US Treasury yields ticked higher, limiting the slump, but closed the week little changed and near their lows, another sign of increased demand for safety.
At the end of the week, Japan published August National inflation figures at the beginning of the day, which missed expectations. Annual CPI increased by just 0.2%, while the core reading came in at -0.4% as expected. Japan will be on holidays on Monday and Tuesday, which means there are no macroeconomic data scheduled for release.
The USD/JPY pair posted its lowest daily close since last March and is poised to extend its decline. The daily chart shows that it fell well below all of its moving averages, which offer modest bearish slopes. Technical indicators, in the meantime, head south within negative levels, reflecting the strength of selling interest. In the 4-hour chart, technical indicators recovered sharply from oversold levels but remain within negative levels. The 20 SMA, in the meantime, head firmly lower below the larger ones, currently at around 108.90, providing dynamic resistance.
Support levels: 104.20 103.85 103.40
Resistance levels: 104.90 105.25 105.60
GBPUSD
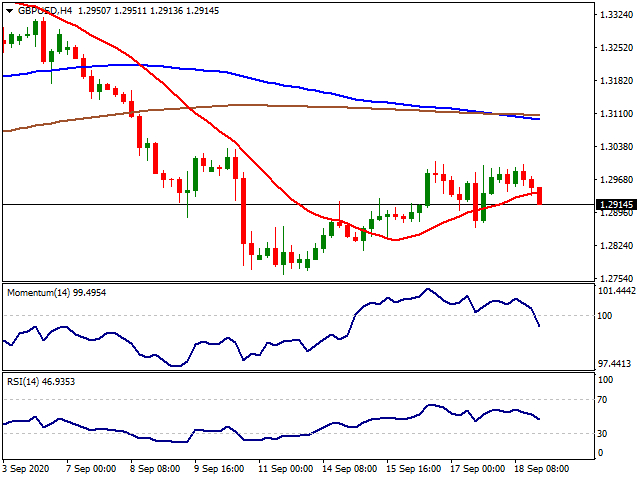
The GBP/USD pair stalled its weekly recovery on Friday, ending the day in the red at around 1.2915. Mild hopes related to a post-Brexit trade deal with the EU provided modest support to Sterling earlier in the week. The UK currency lost momentum on the heels of an increase in the number of COVID-19 cases. The kingdom put under lockdown some cities in the north, and, over the weekend, PM Johnson was said to be considering tightening restrictions as they are now “seeing a second wave.” News suggest that the UK will ban households mixing and reduce opening hours for pubs.
By the end of the week, the kingdom released August Retail Sales, which rose 0.8% MoM, beating expectations, while sales were up 2.8% when compared to a year earlier, missing expectations but doubling the previous 1.4%. This Monday, BOE members will speak before a parliamentary committee presenting the Inflation Report Hearings.
The daily chart for the GBP/USD pair indicates that the risk remains skewed to the downside, as the pair keeps developing below a mildly bearish 20 DMA, while technical indicators head south within negative levels. The pair bottomed at 1.2762 this month, with the 100 and 200 DMAs converging not far below the level. In the 4-hour chart, technical readings also support another leg lower, as the pair broke below its 20 SMA after spending most of the week below the lager ones, as technical indicators entered negative territory with sharp bearish slopes.
Support levels: 1.2900 1.2860 1.2810
Resistance levels: 1.2950 1.2990 1.3045
AUDUSD
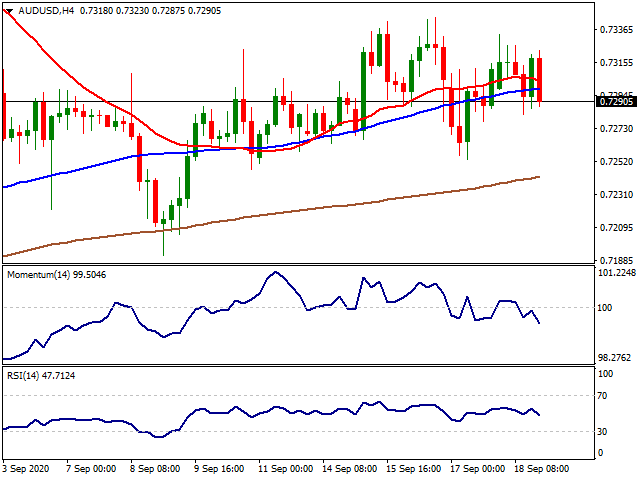
The AUD/USD pair heads into Monday’s opening trading a few pips below 0.7300, after spending another week hovering around this last, without any directional strength. Broad dollar’s strength opposed to falling equities, leaving AUD/USD traders without a certain directional clue. Softer gold prices throughout the week helped in keeping the upside limited.
It may start the week gaping higher, as, during the weekend, PM Morrison said he is expecting to see a jobs bounce-back as Victoria prepares to reopen. New coronavirus cases in the area fell to 14 on Sunday, the lowest in three months, supporting plans to start lifting restrictions on September 28. The Australian macroeconomic calendar had nothing to offer this Monday.
Daily basis, the AUD/USD pair is developing above a mildly bullish 20 DMA, while the larger ones keep advancing below it. Technical indicators, however, lack directional strength, the Momentum within neutral levels and the RSI around 55. The bearish potential seems quite limited due to price behavior and despite easing indicators. In the shorter-term, and according to the 4-hour chart, the risk skews to the downside, as technical indicators head firmly lower within negative levels, as the pair settled below its 20 and 100 SMAs.
Support levels: 0.7250 0.7215 0.7170
Resistance levels: 0.7310 0.7350 0.7385
GOLD
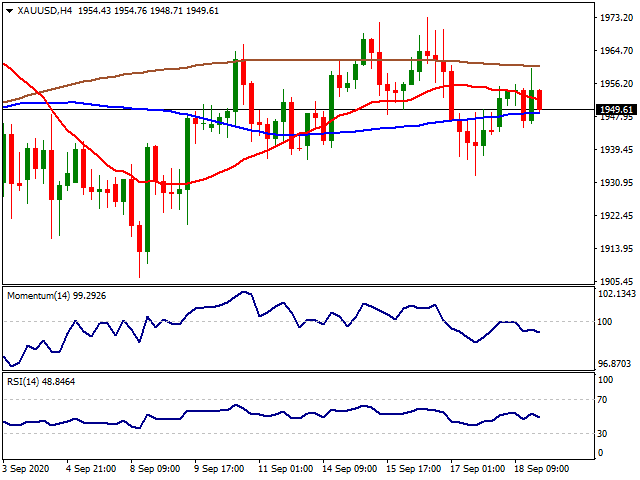
Spot gold spent the last trading day of the week confined to familiar levels, ending the week with modest gains at 1,949.61. The metal found support in falling equities markets, as European and American indexes closed in the red, weighed by ruling risk-aversion. Concerns about global growth within the ongoing pandemic scenario were behind it. Furthermore, mounting concerns about a second coronavirus wages reaching Europe and focused lockdowns in the Union will likely continue to provoke the dismal mood.
The bright metal has spent over a week hovering around a directionless 20 SMA in the daily chart, although the 100 and 200 SMA maintain their strong bullish slopes well below the current level. Technical indicators, in the meantime, head nowhere around their midlines, all of which indicate absent selling interest at the time being. For the shorter-term, and according to the 4-hour chart, the metal has a modest bearish bias, although would need to break below 1,932.70 to confirm a leg south. In the mentioned time frame, the metal is trapped within directionless moving averages, while technical indicators slowly grind lower from their midlines.
Support levels: 1,945.80 1,938.90 1,932.70
Resistance levels: 1,955.10 1,963.20 1,970.00
SILVER
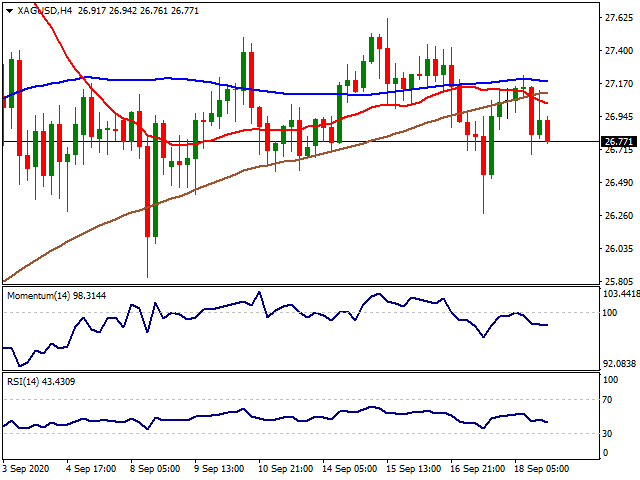
Silver settled for the week at $26.77 per ounce, unchanged for a second consecutive week. The white metal, however, hit a higher high for the week, as well as a higher low, somehow suggesting investors are willing to hold on to its long positions but paused buying. This last can be attributed to central banks maintaining the status quo, and falling short of announcing additional stimulus measures.
From a technical point of view, silver is neutral-to-bearish, as it has finished the week just below a flat 20 DMA, which provides dynamic resistance at around 27.20, as technical indicators turn south within neutral levels. In the shorter-term, and according to the 4-hour chart, the risk of a downward move is higher, as the pair settled below a congesting moving averages, while the RSI indicator aims south around 43. The Momentum indicator, however, is flat just below its 100 line. A steeper decline is to be expected on a break below 26.70, the immediate support level.
Support levels: 26.70 26.55 26.30
Resistance levels: 27.20 27.45 27.60
CRUDE WTI
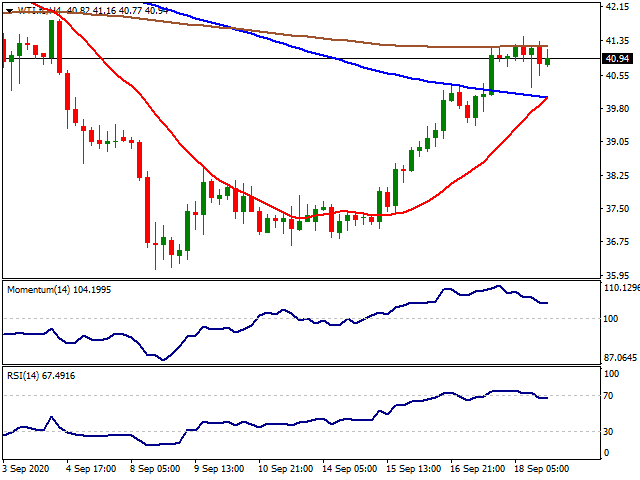
After benefitting the decline seen in oil stocks in the US, WTI had a tight-range trading session on Friday managing to stay over 40.00$ level. Also, OPEC+ statement on Thursday which declared that the cartel will stick to better compliance with oil production cuts to prevent possible falls in prices supported the black gold. On the other hand, US offshore drillers and exporters began a clearup on Thursday after Hurricane Sally weakened to a depression and started rebooting idle Gulf of Mexico rigs after closing them down for five days, said Reuters during the early Friday. After testing its lowest levels since mid-June, WTI managed to return to its consolidation zone between 40.00$ and 42.00$. 40.00$ support is the bottom of WTI’s consolidation range since the end of July and its crucial for black gold to hold this level. If WTI manages to hold over 40.56$ (65.62$-0.00$ %61.80) level, the targets upside can be followed at 41.00$, 46.57$ (March decline start) and 50.00$ levels. Below the 40.00$, the supports can be followed at 39.00$ and 32.81$ (65.62$-0.00$ %50) levels.
Support Levels: 40.00$ 39.00$ 32.81$
Resistance Levels: 41.00$ 46.57$ 50.00$
DOW JONES
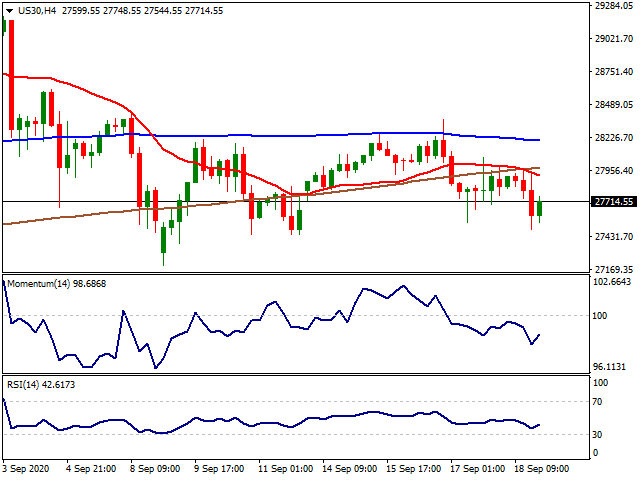
Dow Jones’s attempt to re-gain 28.400 level last week failed and the index ended the week with losses on a weekly basis. In general, the US indexes posted losses for the third consecutive week. On the other hand, despite the uncertainty about the new stimulus program, the USD index DXY managed to end the week at 93.00 level. The tension between the US and China is now being carried to social media platforms and added extra pressure over risk appetite.
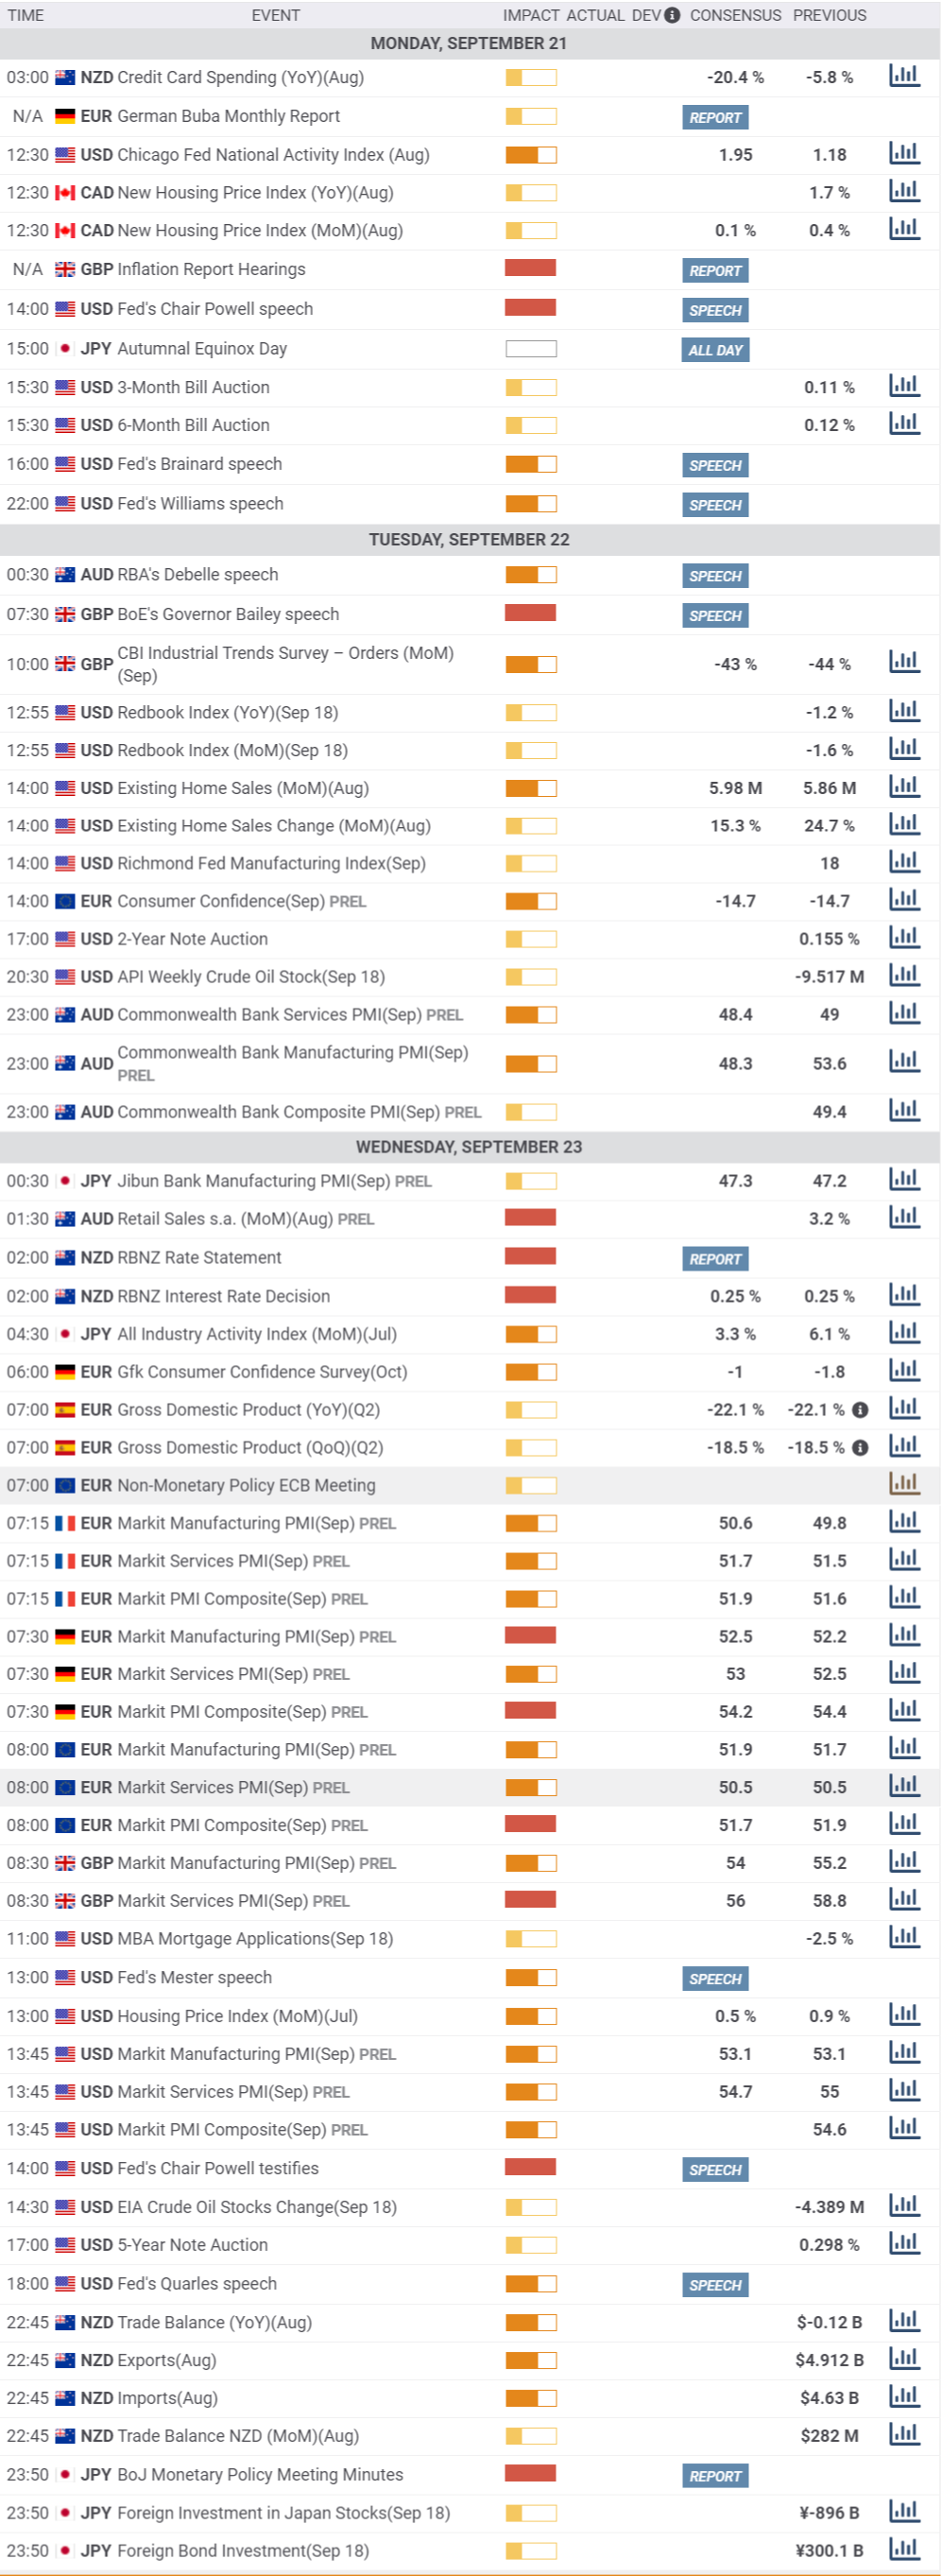
The week will kick-off with the Chicago Fed National Activity Index (Aug) and FED’s Powell, Brainard and Williams' speeches on Monday. On Tuesday, Existing Home Sales (MoM)(Aug) will be followed by Powell’s testimony on Wednesday and Thursday along with other FED officials. And on Friday, Durable Goods Orders(Aug) will be followed by the traders.
From the technical point of view, over the physiological 28.000 level, 28.400 can be followed as next resistance while below 27.770 level the supports can be seen at 27.400, 27.000 and 26.757 (24.680-27.400 %23.60) levels.
Support Levels: 27.700 27.400 27.000
Resistance Levels: 28.400 29.000 29.500
MACROECONOMIC EVENTS
* All the Moving Average support and resistance levels are dynamic by nature. Means when the price approaches the Moving averages, slight variation occurs in the forecasted Moving Average support and resistance levels. Previous few days’ intraday levels are also signicant while trading the current day as the price tend to hover around these levels for some time. Levels in red indicate strong, critical or vital.
Please remember that trading financial markets carry a high degree of risk to your capital. It is possible to lose more than your initial stake. Leveraged products may not be suitable for all investors, therefore please ensure you fully understand the risks involved and seek independent advice if necessary.
All Rights Reserved © Noor Al Mal
#9月美联储决议“鸽声依旧”##TikTok不卖了##欧央行决议按兵不动##无协议脱欧风险又来##美股狂飙要到头了吗#
Edited 21 Sep 2020, 09:31
Disclaimer: The content above represents only the views of the author or guest. It does not represent any views or positions of FOLLOWME and does not mean that FOLLOWME agrees with its statement or description, nor does it constitute any investment advice. For all actions taken by visitors based on information provided by the FOLLOWME community, the community does not assume any form of liability unless otherwise expressly promised in writing.
FOLLOWME Trading Community Website: https://www.followme.com


Hot
No comment on record. Start new comment.