EUR/USD Price Analysis: Bears flirting with 1-month-old ascending channel support

- EUR/USD drops to fresh weekly lows during the early North American session on Friday.
- The set-up supports prospects for an eventual break below an ascending trend-channel.
- Bears might now aim to retest August monthly swing lows, near the 1.1700-1.1695 area.
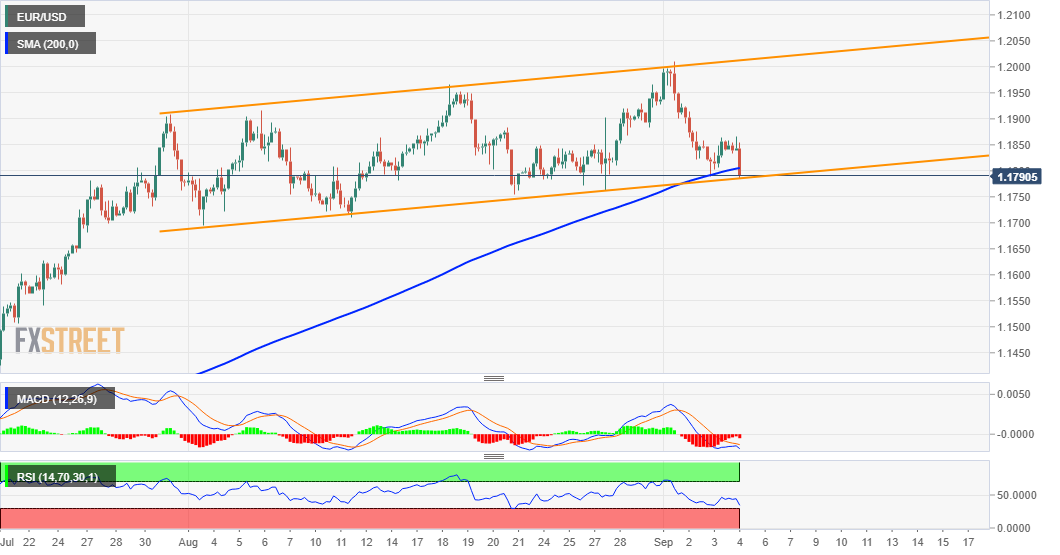
The EUR/USD pair refreshed weekly lows, around the 1.1785 region in the post-NFP trading action, with bears now eyeing a sustained break below one-month-old ascending channel support.
Given that the pair has now slipped below the 200-period SMA on the 4-hourly chart, the bias might have already shifted in favour of bearish traders amid a strong pickup in the USD demand. The negative outlook is further reinforced by the fact that oscillators on the daily chart have already lost positive momentum and have been drifting lower in the bearish territory.
A subsequent fall below the 1.1760-55 region will confirm a near-term bearish breakdown and drag the pair further towards August monthly swing lows, around the 1.1700-1.1695 region. Some follow-through selling should pave the way for an extension of the recent corrective slide from over two-year tops, or levels beyond the key 1.2000 psychological mark set on Tuesday.
On the flip side, any meaningful recovery back above the 1.1800 mark now seems to confront a stiff resistance and is more likely to remain capped near the 1.1850-55 horizontal zone. That said, a sustained strength beyond might trigger a short-covering move and push the pair back above the 1.1900 mark, towards testing the next major hurdle near the 1.1930-35 region.
EUR/USD 4-hourly chart
Technical levels to watch
EUR/USD
| OVERVIEW | |
|---|---|
| Today last price | 1.1799 |
| Today Daily Change | -0.0053 |
| Today Daily Change % | -0.45 |
| Today daily open | 1.1852 |
| TRENDS | |
|---|---|
| Daily SMA20 | 1.1837 |
| Daily SMA50 | 1.1632 |
| Daily SMA100 | 1.1331 |
| Daily SMA200 | 1.1182 |
| LEVELS | |
|---|---|
| Previous Daily High | 1.1865 |
| Previous Daily Low | 1.1789 |
| Previous Weekly High | 1.192 |
| Previous Weekly Low | 1.1762 |
| Previous Monthly High | 1.1966 |
| Previous Monthly Low | 1.1696 |
| Daily Fibonacci 38.2% | 1.1818 |
| Daily Fibonacci 61.8% | 1.1836 |
| Daily Pivot Point S1 | 1.1806 |
| Daily Pivot Point S2 | 1.176 |
| Daily Pivot Point S3 | 1.173 |
| Daily Pivot Point R1 | 1.1881 |
| Daily Pivot Point R2 | 1.1911 |
| Daily Pivot Point R3 | 1.1957 |
Reprinted from fxstreet , the copyrights all reserved by the original author.
Disclaimer: The content above represents only the views of the author or guest. It does not represent any views or positions of FOLLOWME and does not mean that FOLLOWME agrees with its statement or description, nor does it constitute any investment advice. For all actions taken by visitors based on information provided by the FOLLOWME community, the community does not assume any form of liability unless otherwise expressly promised in writing.
FOLLOWME Trading Community Website: https://www.followme.com


Hot
No comment on record. Start new comment.