Ripple Price Analysis: XRP/USD is not out of woods as long as it stays below $0.31

- XRP/USD has recovered from the intraday low amid the improved market sentiments.
- A strong resistance may limit long-term growth at $0.31.
Ripple's XRP regained ground after a severe sell-off to $0.2400 during early Asian hours on Friday. Currently, XRP/USD is changing hands at $0.2640, having gained over 7% since the start of the day. Despite the recovery, the coin is still 2% lower from this time on Thursday. Ripple now takes fourth place in the global cryptocurrency market rating, with the current market capitalization of $11.8 billion. The coin's average daily trading volume has exceeded $2 billion for the first time since August 19.
XRP/USD: The technical picture
Ripple's XRP managed to rebound from the critical support level of $0.2400 and regained some ground. But the long-term technical picture implies that the token is not out of the woods yet. Let's have a closer look at what may be in store for XRP.
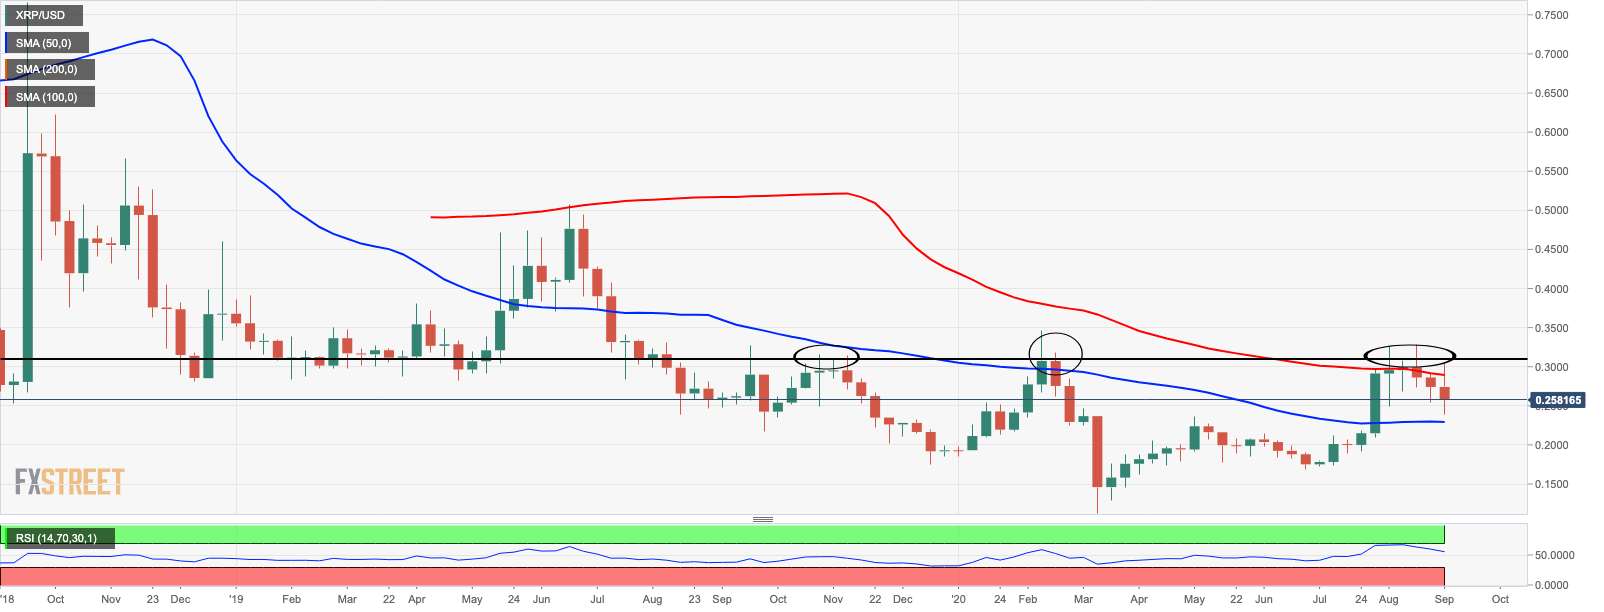
On a weekly chart, the price is moving in a channel, limited by SMA100 (currently at $0.2895) on the upside and SMA50 (presently at $0.2300) on the downside. While the price stopped short of the above-said channel support area, the further recovery may be limited as a few technical indicators are sending bearish signals. First of all, both SMAs point downwards, which creates a bearish price channel. The RSI on a weekly chart has also reverted from overbought territory and pointed to the South, which confirms the growing bearish potential in the long run.
A sustainable move above $$0.31 is needed to improve the technical picture and set the bullish ball rolling for XRP. This resistance area has been tested trice, and each time the bulls backed off.
XRP/USD weekly chart
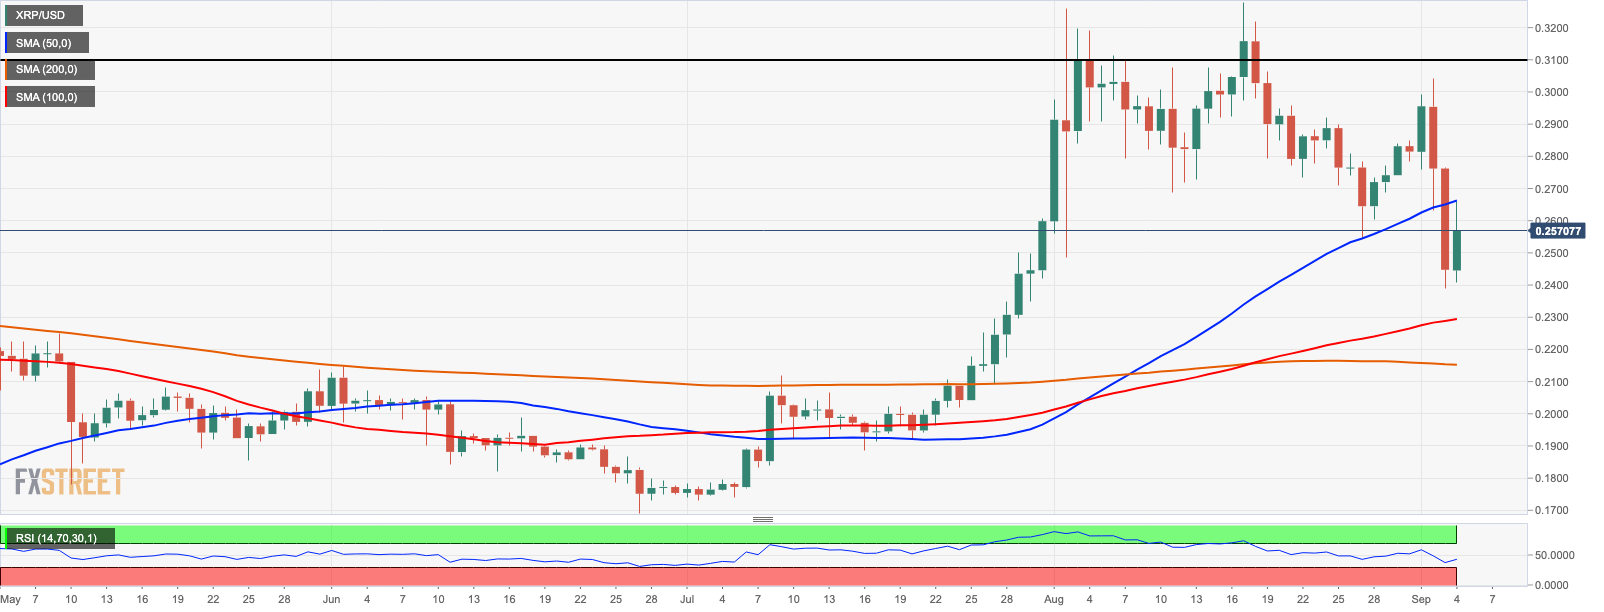
On a daily chart, the price recovery is capped by SMA50 at $0.266. This technical line was tested as support on several occasions late in August; now, it has been verified as a resistance. Once it is out of the way, the upside is likely to gain traction with the next focus on the above-mentioned congestion area of $0.31, followed by the recent XRP's recovery high on approach to $0.32.
A failure to settle above the daily SMA50 will increase the downside pressure and bring the above-mentioned $0.23 into focus. This barrier is also reinforced by the SMA100 on a daily chart.
XRP/USD daily chart
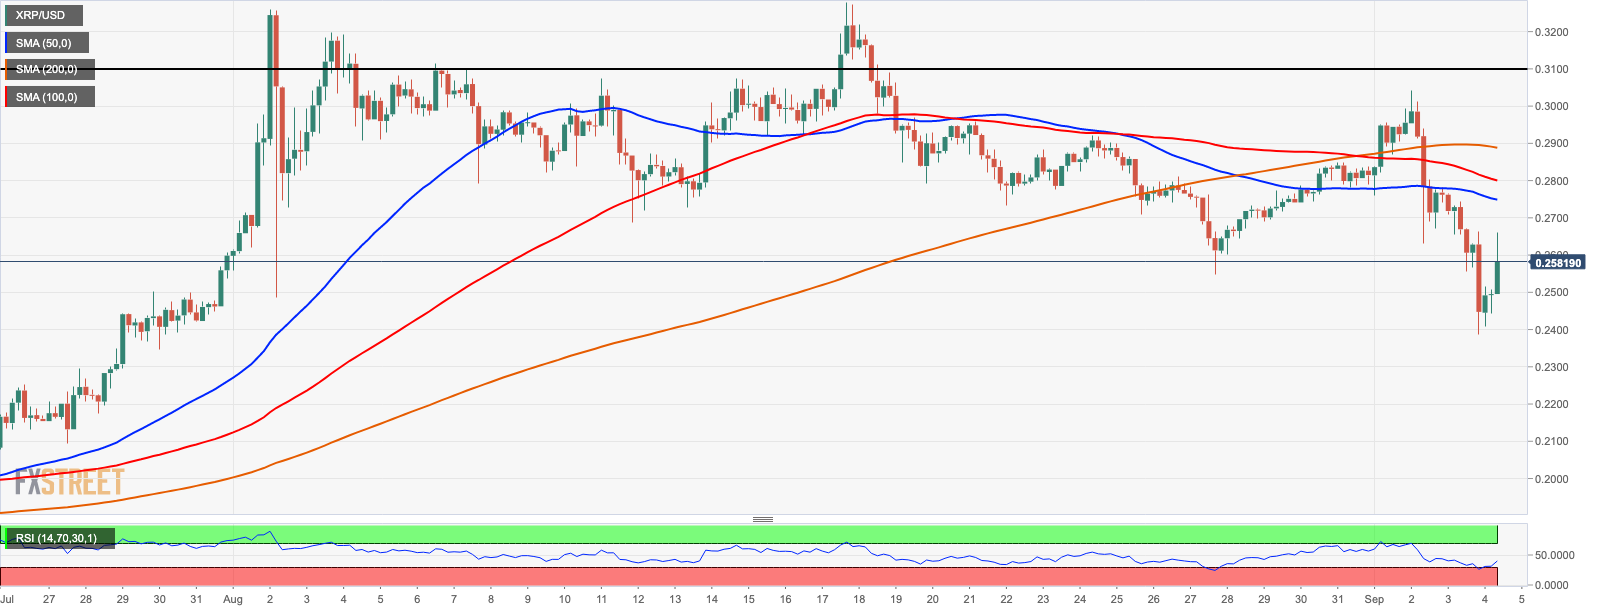
The intraday charts say that XRP may continue the recovery as the 4-hour RSI has reversed from oversold territory and now points upwards. However, a cluster of the resistance levels above the current price may slow discourage the bulls and slow down the momentum. The 4-hour SMA50 at $0.275 creates the first barrier, which is closely followed by SMA100 at $0.28 and SMA200 on approach to $0.29. However, the critical resistance is still located at $0.31.
XRP/USD 4-hour chart
To conclude: XRP/USD may proceed with the short-term recovery; however, in the long-run, the price is still vulnerable to losses as long as it stays below the critical resistance of $0.31.
Reprinted from fxstreet , the copyrights all reserved by the original author.
Disclaimer: The content above represents only the views of the author or guest. It does not represent any views or positions of FOLLOWME and does not mean that FOLLOWME agrees with its statement or description, nor does it constitute any investment advice. For all actions taken by visitors based on information provided by the FOLLOWME community, the community does not assume any form of liability unless otherwise expressly promised in writing.
FOLLOWME Trading Community Website: https://www.followme.com


Hot
No comment on record. Start new comment.