Bitcoin Cash Chart Analysis: Downside appears compelling amid bearish crossover

- BCH/USD consolidates the sharp sell-off to $277.
- No. 5 coin remains exposed to downside risks in the near-term.
- Hourly RSI inches lower below the midline, with bearish HMAs crossover.
After a volatile session witnessed on Friday, Bitcoin Cash (BCH/USD) is consolidating in a $10 narrow range, as the bears gear up for the next push lower. The No. 5 coin rallied as high as $326 on Friday before seeing a sharp sell-off to $277, although managed to settle above the $300 level. The digital asset has stalled its recovery momentum in a quiet Saturday trading so far, keeping its range around $303. Despite the pullback, the spot sheds over 5.50% over the last 24 hours, enjoying a market capitalization of $5.60 billion.
BCH/USD: Hourly chart
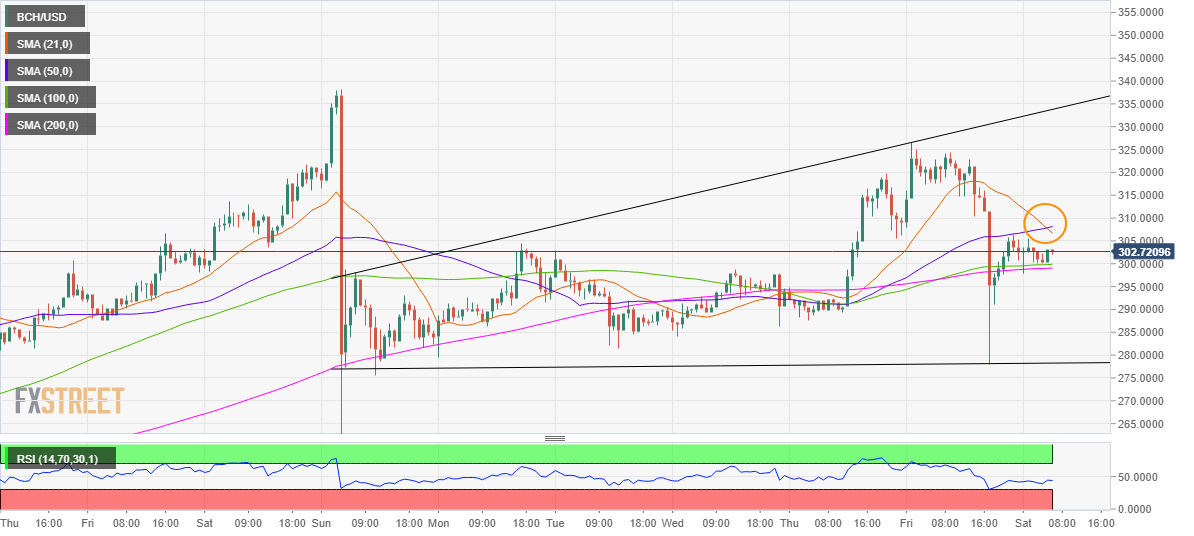
As observed in the hourly, the coin continues to range in a broadening pattern since last Sunday, with the downside bias more compelling after the price faced rejection on several occasions at the upper trendline boundary of the pattern.
More so, the 21-hourly Simple Moving Average (HMA) has pierced the 50-HMA from above, suggesting that the bears are likely to retain control in the near-term.
Therefore, a break below the powerful support at $299 is critical for further declines. That level is the confluence of the horizontal 100 and 200-HMAs.
Entry for the sellers below the latter will open floors towards lower trendline boundary at $277, which is coincides with Friday’s low. The hourly Relative Strength Index (RSI) points south below the midline, suggesting more weakness ahead.
BCH/USD: Additional levels to consider
BCH/USD
| OVERVIEW | |
|---|---|
| Today last price | 302.6188 |
| Today Daily Change | 0.1096 |
| Today Daily Change % | 0.04 |
| Today daily open | 302.4992 |
| TRENDS | |
|---|---|
| Daily SMA20 | 271.4474 |
| Daily SMA50 | 246.6976 |
| Daily SMA100 | 245.238 |
| Daily SMA200 | 272.6663 |
| LEVELS | |
|---|---|
| Previous Daily High | 326.5666 |
| Previous Daily Low | 277.9748 |
| Previous Weekly High | 338.2532 |
| Previous Weekly Low | 244.1306 |
| Previous Monthly High | 306.6192 |
| Previous Monthly Low | 215.8202 |
| Daily Fibonacci 38.2% | 296.5369 |
| Daily Fibonacci 61.8% | 308.0045 |
| Daily Pivot Point S1 | 278.1271 |
| Daily Pivot Point S2 | 253.7551 |
| Daily Pivot Point S3 | 229.5353 |
| Daily Pivot Point R1 | 326.7189 |
| Daily Pivot Point R2 | 350.9386 |
| Daily Pivot Point R3 | 375.3107 |
Reprinted from fxstreet , the copyrights all reserved by the original author.
Disclaimer: The content above represents only the views of the author or guest. It does not represent any views or positions of FOLLOWME and does not mean that FOLLOWME agrees with its statement or description, nor does it constitute any investment advice. For all actions taken by visitors based on information provided by the FOLLOWME community, the community does not assume any form of liability unless otherwise expressly promised in writing.
FOLLOWME Trading Community Website: https://www.followme.com


Hot
-THE END-