Daily Market Report - 6th July 2020


$50 Free Margin Account Campaign: https://www.nooralmal.com/cc19...
EURUSD
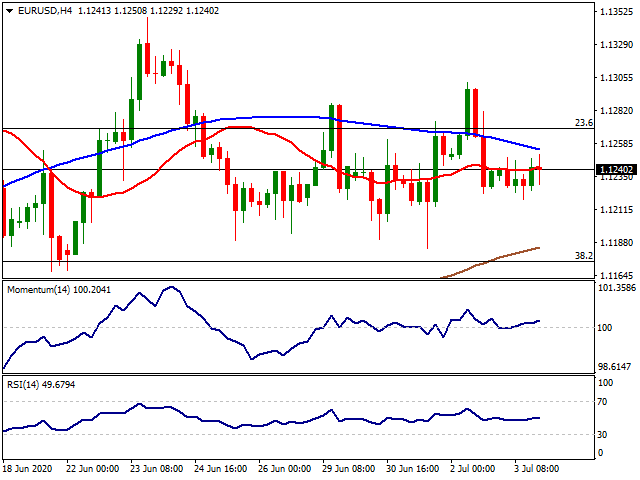
Range trading was exacerbated by a US holiday at the end of the week, with volumes across the FX board at lows throughout the day. The EUR/USD closed a third consecutive week little changed in the 1.1240 price zone. By the end of the week, Markit released the final versions of the June EU Services PMI, which were revised higher from preliminary estimates, although most figures remained within contraction levels. For the whole Union, the index came in at 48.3 against the previous estimate of 47.3.
During the weekend, ECB President Christine Lagarde said that the EU would likely face two years of downward pressure on prices, amid a transformation of the economy as a result of the coronavirus pandemic. Lagarde said that the economy is facing a transition period to new economic models, with greater digitization and automation, affecting employment and production. In the meantime, the central bank will need to keep its monetary policy exceptionally loose.
This Monday, Germany will publish May Factory Orders, while the EU will unveil Retail Sales for the same month. The market will probably pay little attention to these “old” numbers. Instead, the focus will be on the EU July Sentix Investor Confidence, foreseen at -11 from -24.8, and the US ISM Non-Manufacturing PMI, seen recovering in Ju to 49.5 from 45.4.
The EUR/USD pair has been consolidating between 1.1170 and 1.1330 for three consecutive weeks, neutral in the daily chart. However, the risk is slowly skewing to the downside, as, in the daily chart, the pair remained these last few days below a mild bearish 20 SMA, while the Momentum indicator turned lower within negative levels. In the shorter-term, and according to the 4-hour chart, the pair is also neutral, trading between moving averages and with technical indicators hovering around their midlines.
Support levels: 1.1210 1.1170 1.1125
Resistance levels: 1.1270 1.1310 1.1350
USDJPY
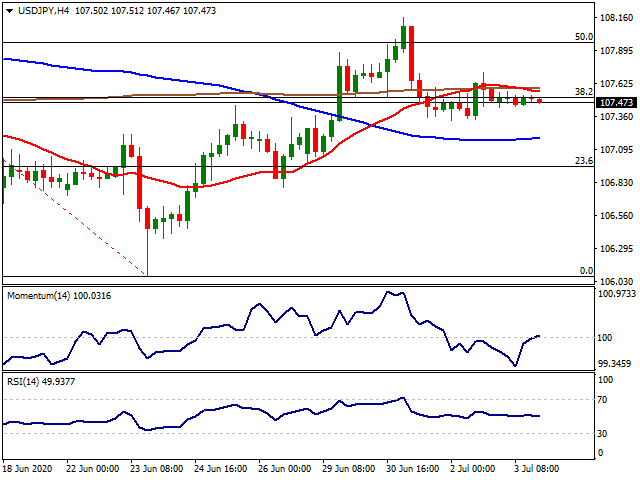
After reaching a three-week high of 108.16 mid-week, the USD/JPY pair ended it with modest gains around 107.50. On Friday, the pair was confined to a tight 20 pips’ range, clearly reflecting the pair’s dependence on the market’s sentiment. With US markets closed amid a local holiday, the pair was unable to attract investors. By the end of the week, Asian shares managed to post some gains, although European indexes closed in the red.
Japan published the June Jibun Bank Services PMI, which recovered from 26.5 to 45, the first encouraging sign in these chaotic months. The country won’t publish any data this Monday.
The daily chart for the USD/JPY pair offers a neutral-to-bearish stance, stuck around the 38.2% retracement of its latest daily decline. In the mentioned time-frame, the pair is a handful of pips above a bearish 20 SMA while below the larger ones, as technical indicators remain flat around their midlines. In the 4-hour chart, the picture is the same, as technical indicators head nowhere within neutral levels as the pair holds between directionless moving averages.
Support levels: 107.20 106.95 106.60
Resistance levels: 107.95 108.30 108.65
GBPUSD
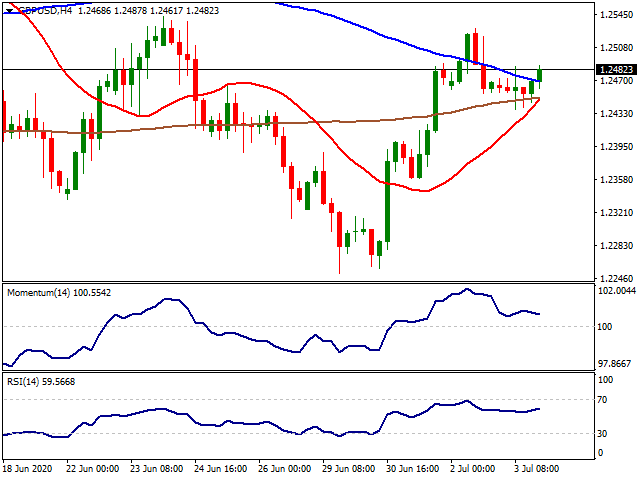
The GBP/USD pair has remained unchanged just below the 1.2500 threshold on Friday but closed the week with substantial gains. Hopes mixed with fears by the end of the week, as Britons welcomed the reopening of social activities on Saturday. The news overshadowed concerns related to Brexit talks, which broke up early on Thursday, amid serious disagreements between the two parts. Nevertheless, both parts committed to another round of talks this week in London, and market players expect the EU and the UK to reach an agreement on trade by October.
In the data front, the UK saw the release of the final version of the June Markit Services PMI, which was upwardly revised to 47.1 from 47. On Monday, the UK will publish the June Markit Construction PMI, foreseen at 47 from 28.9.
The GBP/USD pair is heading into the weekly opening trading at 1.2482, and with the bullish potential limited, according to the daily chart. The price is hovering around a mildly bearish 100 DMA and below a firmly bearish 20 DMA, while technical indicators have lost their upward strength and turned modestly lower around their midlines. In the 4-hour chart, the pair settled above a congestion of moving averages, while technical indicators remain within positive levels, although with divergent strength. The downside seems limited for now, but the bearish case will likely gain adepts on a break below 1.2400.
Support levels: 1.2440 1.2400 1.2360
Resistance levels: 1.2505 1.2560 1.26
AUDUSD
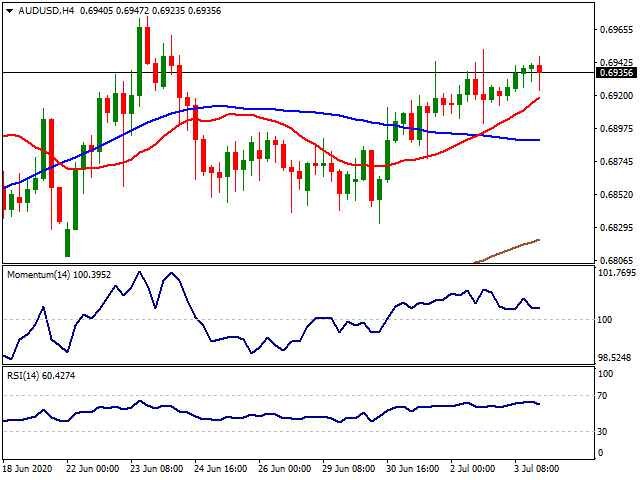
The AUD/USD pair closed with gains around 0.6940, up for a second consecutive week, but within familiar levels. Despite the broad dollar’s weakness, the pair was unable to rally amid the dismal market’s mood, with concerns focused on the continued increase in coronavirus cases, mainly in the US. In Australia, however, the number of cases also rose by the end of the previous week, with the country reporting over 80 new cases a day from average new cases of 20 in the previous weeks.
Australian data released on Friday failed to impress, further limiting the bullish potential of the pair. The June AIG Performance of Construction Index printed at 35.5, recovering from 24.9. The Commonwealth Bank Services PMI for the same month was downwardly revised to 53.1, slightly worse than previously estimated. Retail Sales, however, printed a whopping advance of 16.9% In May. On the other hand, Chinese data beat expectations as the Caixin Services PMI unexpectedly surged to 58.4 from 55 in May, and against the 49.9 expected. This Monday, Australia will unveil the June TD Securities Inflation report.
The AUD/USD pair is neutral in its daily chart, as it is trading a handful of pips above a flat 20 DMA, while the larger moving averages are also directionless, but far below the current level. The Momentum indicator remains lifeless around its midline, while the RSI grinds higher around 61, skewing the risk to the upside without confirming it. In the shorter-term, and according to the 4-hour chart, the pair still has a chance of heading towards 0.7000, as a bullish 20 SMA contains the downside. Nevertheless, technical indicators lost their upward strength, easing within positive levels.
Support levels: 0.6895 0.6850 0.6810
Resistance levels: 0.6950 0.6990 0.7015
GOLD
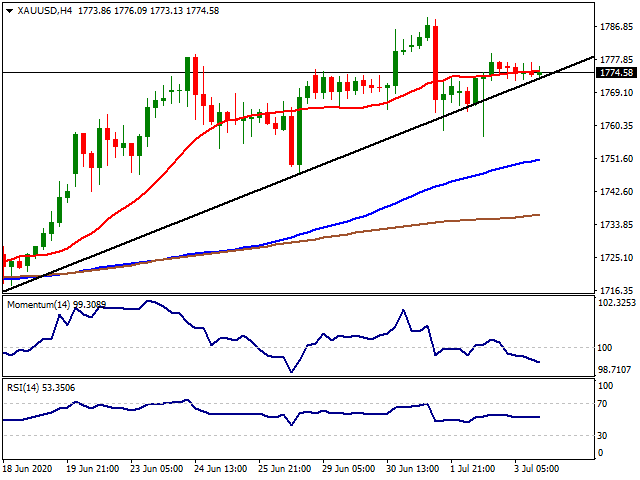
Gold had a tight trading range on Friday as the markets in the US were closed due to 4th of July holiday. Last week, Gold retraced from its eight year’s heights after a move supported by the fears of surging new coronavirus cases. On the other hand, positive sentiment is supported by better than expected macro-data signalling a faster V-shaped recovery might be on the way. On the other hand, Gold has been sensitive to the US 10-year Treasury yield. The last drop in gold below USD1,700 per ounce earlier this month was accompanied by a jump in the US 10-year Treasury yield to 0.95%. Therefore, in the normalization period, the traditional USD-Gold correlation might be observed along with the extreme liquidation and zero interest rates. After the robust NFP data set last week, ISM Non-Manufacturing PMI(Jul) on Monday in the US will be followed. Also, on Thursday, the inflation data set from China and initial jobless claims from the US will be followed by the traders in a data-weak trading week.
In terms of technical levels, over the 1.765$ (May 2020 peak), the resistances might be followed at 1.785$ (2012 multi-time peak), 1.800$ and 1.822$ levels. Below the 1.765$, the supports can be followed at 1.750$(December 2012 peak), 1.738$ (April double top) and 1.700$.
Support Levels: 1.750$ 1.738$ 1.700$
Resistance Levels: 1.785$ 1.800$ 1.822$
DOW JONES
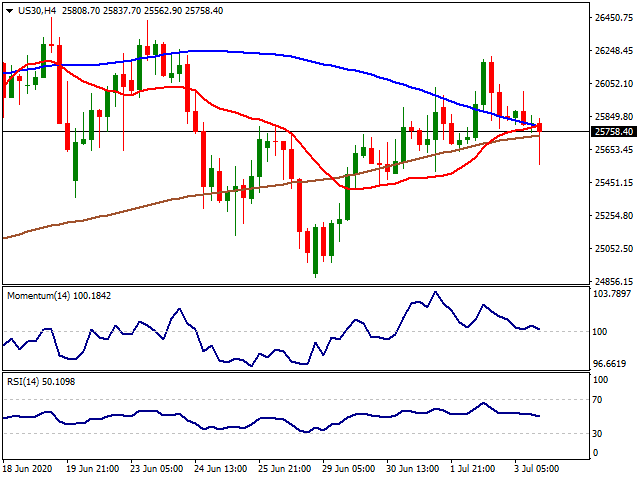
While the markets were closed in the US on Friday due to the 4th of July holiday, futures had a mixed-negative trading session ending the day below 26.000 at 25.750. While the increase in the new coronavirus cases in the US forcing some states to re-impose countermeasures, also, in Spain regional lockdowns announced as the number of cases peaked recently. On Thursday, Wall Street rose after the Labor Department reported U.S. nonfarm jobs increased by 4.8 million in June, far better than the 2.9 million jump economists polled by Dow Jones had been expecting. Also, the investors cheered a decline in the national unemployment rate, which dropped to 11.1% from 13.3% in May. While the USD index DXY is hovering a tick over 97.00 level in a down mood, Gold is keeping its upper range of trading despite the limited retracement on Friday. The week will be slow in terms of macro-data release agenda. ISM Non-Manufacturing PMI(Jul) on Monday in the US will be followed. Also, on Thursday, the inflation data set from China and initial jobless claims from the US will be followed by the traders in a data-weak trading week.
Below the 25.000 level, 24.719 (21.712-29.585 %61.80) 23.500 and 23.000 levels can be followed as support levels while a steady close over 25.667 (21.712-29.585 %50) will most likely to carry Dow Jones to 26.000, 26.577 (21.712-29.585 %38.200) and 27.000 levels.
Support Levels: 25.000 24.719 23.500
Resistance Levels: 26.000 26.577 27.000
XAGGAGAGA
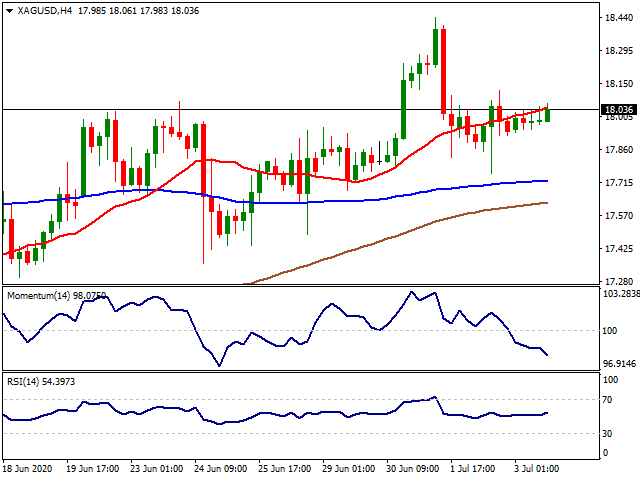
Silver had a slightly better trading day last Friday while the markets in the US were closed due to 4th of July holiday. As the industrial activity is picking up the pace on a global scale, Silver price is founding extra support apart from the precious metal demand. The U.S. Manufacturing Purchasing Managers’ Index (PMI) came in at 52.6% in June after a reading of 43.1% in May. After remaining below 50 (which indicates contraction) for three consecutive months due to the damage inflicted by COVID-19 pandemic, the PMI has finally crossed the 50 mark. The PMI also recorded its largest increase since August 1980, when it increased 10.5 percentage points. Considering the fact that the manufacturing sector accounts for 11% of the U.S. economy, this raises hopes regarding economic recovery. Also, in China, the official NBS Manufacturing PMI was 50.9 in June 2020 — the fourth straight month of increase in factory activity. This is a major recovery from the all-time low PMI reading of 35.7 in February which was due to the coronavirus-induced lockdown. On the other hand, Silver continues Role as a vital component of solar cells and sun-powered generation is expected to double by 2025. Therefore, silver will most likely be a good trader in the longer run.
As 16.97$ (%50.0 14.29$-19.65$) stands as critical support, below this level, a test of 16.33$ (%61.8 14.29$-19.65$) and 15.55$ (%76.40 14.29$-19.65$) can be targeted. On the top side, over the 17.60$ (%38.20 14.29$-19.65$) resistance, 18.38$ (%23.6 14.29$-19.65$), 18.90$ (January and February peak zone) and 19.67$ (2019 peak) can be followed as targets up.
Support Levels: 16.97$ 16.33$ 15.55$
Resistance Levels: 18.38$ 18.70$ 18.90$
OILLIL
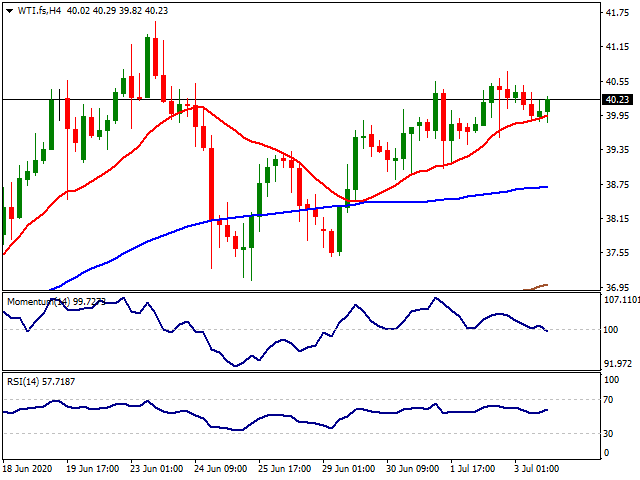
WTI once again failed to break 40.00$ resistance decisively ending the week just a tick around the important level which was tested numerous times since June. The increase of COVID-19 cases has offset market optimism triggered by the record rise on US Non-Farm Payrolls on Thursday and the unexpected decline on oil stocks last week, reported by the EIA. The EIA data showed that the US crude stockpiles fell 7.2 million barrels from a record high last week, far more than analysts had expected, per Reuters. Beyond that, Chinese data released earlier today showed that the country’s services sector activity expanded beyond expectations in June. On the other hand, the reports that the OPEC oil production fell to its lowest in decades in June and Russian production has dropped near its OPEC+ target could also offer some reprieve to the bulls. At this point, the risk appetite supported by the positive data readings will be capped by the surging number of cases, especially in the US will be the drivers of the WTI trade.
A decisive move over 32.81$ (65.62$-0.00$ %50) might carry WTI to 40.56$ (65.62$-0.00$ %61.80), 50.00$ and 54.00 levels. Below the 32.81$ level, 31.00$, 27.40$ (9th of March dip) and 26.00$ levels can be targeted.
Support Levels: 31.00$ 27.40$ 26.00$
Resistance Levels: 40.56$ 50.00$ 54.00$
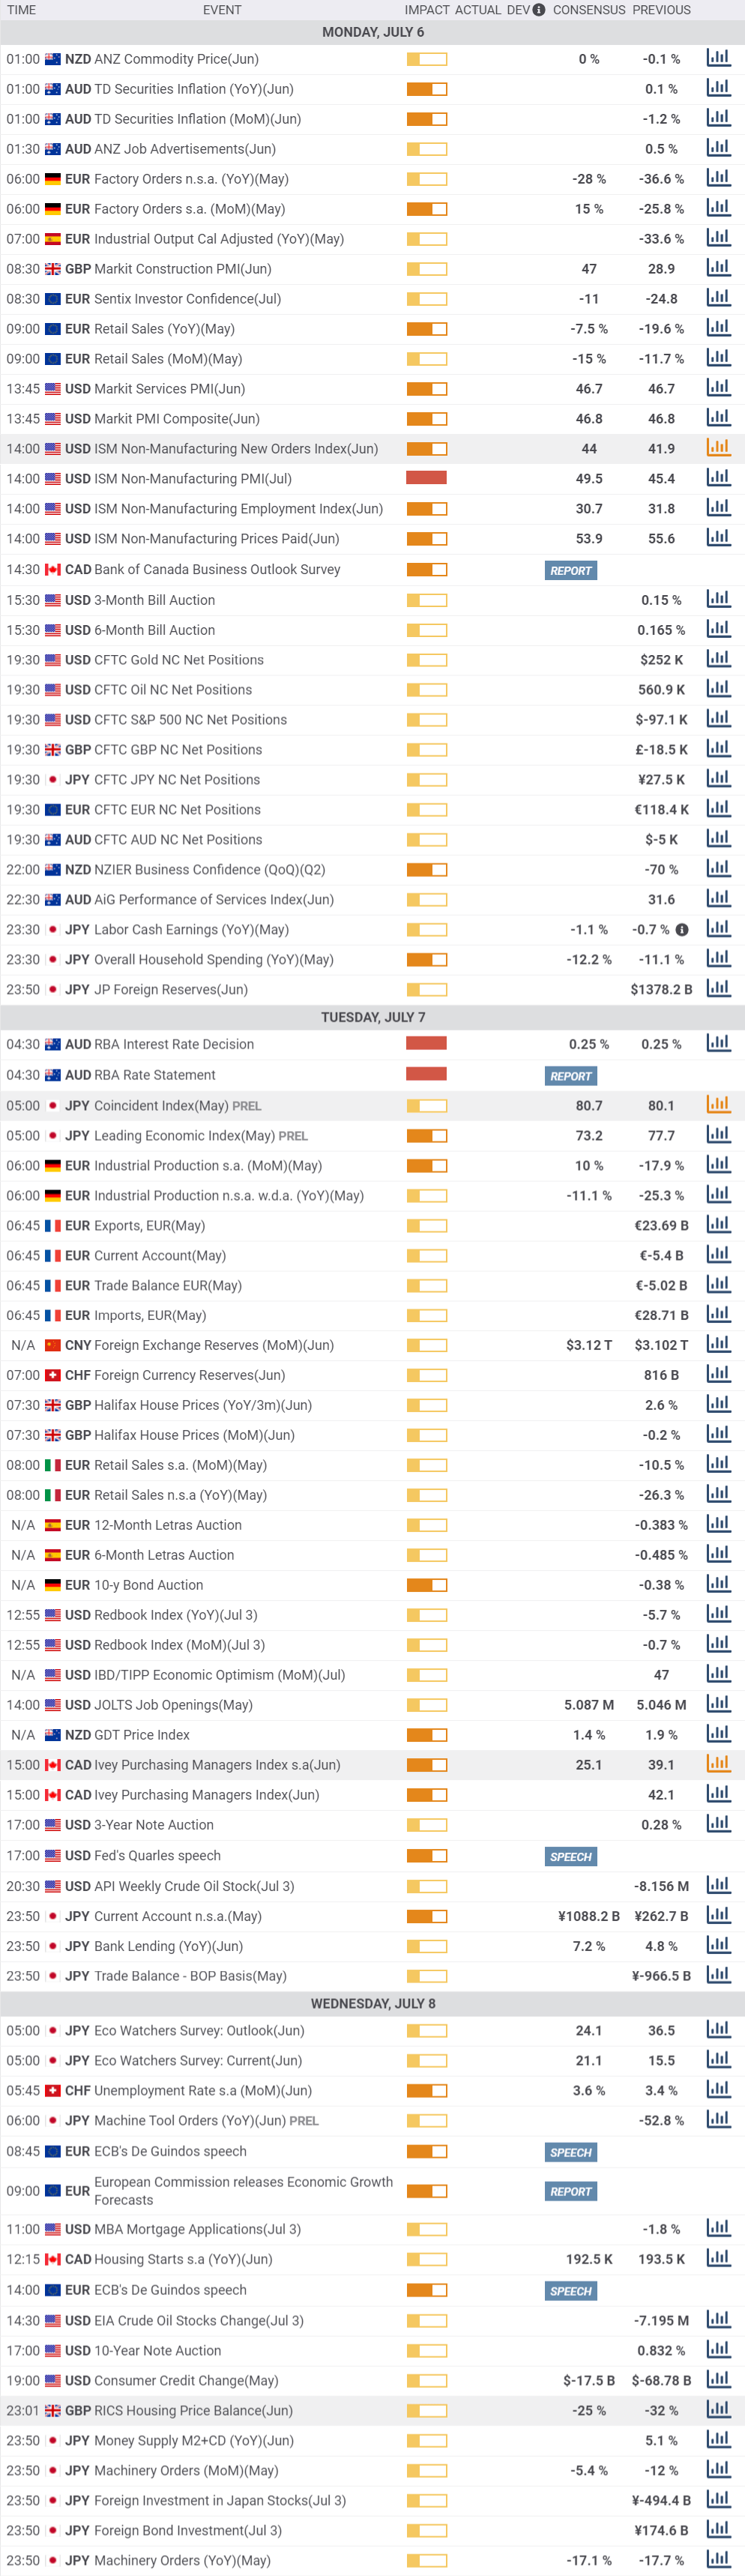
MACROECONOMIC EVENTS
* All the Moving Average support and resistance levels are dynamic by nature. Means when the price approaches the Moving averages, slight variation occurs in the forecasted Moving Average support and resistance levels. Previous few days’ intraday levels are also signicant while trading the current day as the price tend to hover around these levels for some time. Levels in red indicate strong, critical or vital.
Please remember that trading financial markets carry a high degree of risk to your capital. It is possible to lose more than your initial stake. Leveraged products may not be suitable for all investors, therefore please ensure you fully understand the risks involved and seek independent advice if necessary.
All Rights Reserved © Noor Al Mal
Edited 06 Jul 2020, 17:30
Disclaimer: The content above represents only the views of the author or guest. It does not represent any views or positions of FOLLOWME and does not mean that FOLLOWME agrees with its statement or description, nor does it constitute any investment advice. For all actions taken by visitors based on information provided by the FOLLOWME community, the community does not assume any form of liability unless otherwise expressly promised in writing.
FOLLOWME Trading Community Website: https://www.followme.com


Hot
No comment on record. Start new comment.