A Must-Read for Novices:One Careless Move in Marking Supports&Resistances Loses the Whole Game

Some traders think it easy to mark support and resistance levels. Yet it is not always so, even if they identify these levels, how they mark these support and resistance levels are often not exact enough. This may lead to wrong trading decisions, and even big losses.
In my opinion, there may be two things such traders do not do correctly. Let’s cut to the chase: support and resistance levels are not indestructible defensive lines, they could get intercepted by price moves from time to time.
Such is the nature of any trading market: price is always changing.
I noticed that people often makes two mistakes when drawing supports and resistances. There could be other reasons, but these two are obvious, and I would like to elaborate a bit on them.
1. Overdoing it – trading levels should not be marked to fill in the blanks
Don’t overdo it by marking every pivot level in the chart. Many of the lines you are drawing may mean nothing for future price action.
Movements in the market are random and unpredictable. That said, as a trader, we shouldn’t trade arbitrarily, instead, we must set up principles, and do everything for a reason.
You should think about these questions:
- Why do I need to mark this line?
- Will I trade when price hits this line?
- If price hits and reverses from there, should I lock in profits or do anything else?
- Do I need it because it’s a key resistance or support level in the daily, weekly or monthly chart?
If a line doesn’t influence your trading decisions at all, then it should not be marked out.
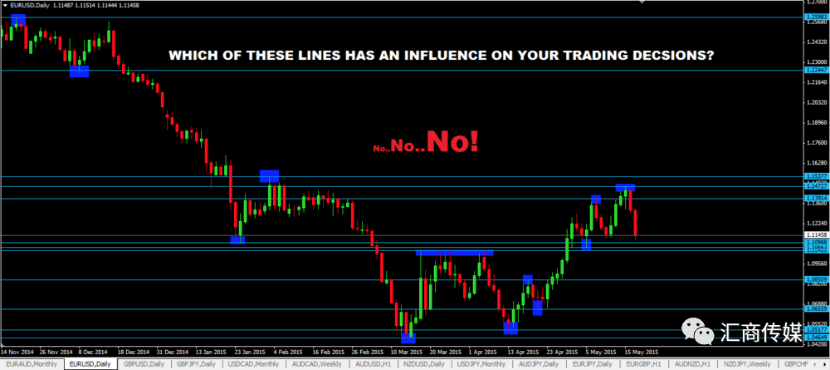
Let’s look at the EUR/USD daily chart, the price was heading down first, then it started to bounce. So we should be looking for the potential support level.
Don’t forget that each level is potential because we can never be certain until it is tested by the price move.
In the above chart, many price levels are marked out, but most of them are useless for me. When the unnecessary lines are removed, we got the chart below.
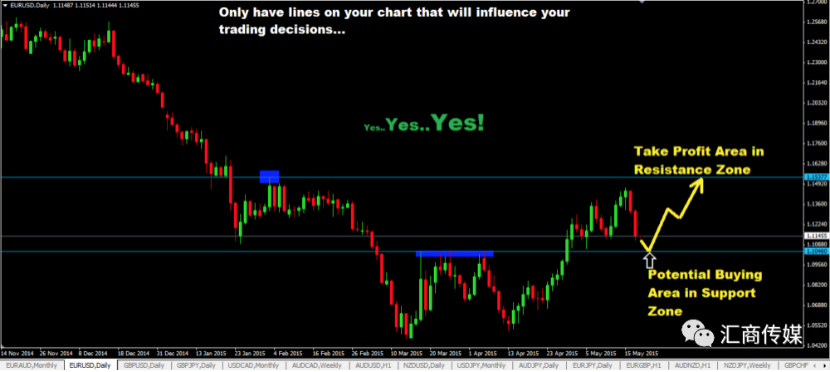
See how clean the chart is now? One should avoid things that hinder market analysis. Only mark levels that are going to impact your trading decisions or future movements.
For example, there’s a major support level on the monthly chart and right now the price is 100 pips away and you see a buying opportunity, then the level is meaningful for you.
There may also be support and resistance lines drawn on the daily chart and the 4-hour charts, but when you are trading the monthly chart, such levels marked on lower time frames would be irrelevant.
2. Too precise
No one can mark perfect support and resistance levels. We can only know the exact movements when it is already the past. Why?
- Price usually hits the same price zone/level 2 or 3 times, then rebounds;
- Price may rebound when there’s still a few pips from the support/resistance levels;
There may be times when price go exactly to the support or resistance level and then rebounds or drops back. But this is a textbook example, it does not happen frequently.
So how should one draw support or resistance lines in situations like these? For me, if there are two or more support levels, I will:
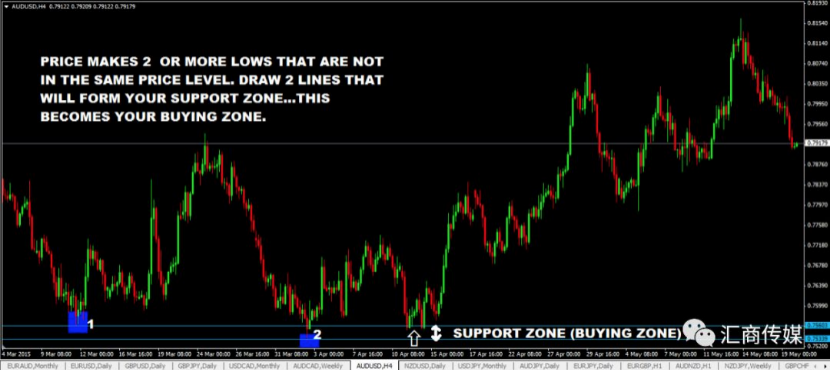
- look for the highest low and the lowest low and draw 2 lines;
- This forms my support zone. Remember a support zone is not a fixed price level;
- Price can come down to this zone between these two lines drawn and bounce back up;
- This support zone is my buying zone.

In the chart above, notice that: 1 is the highest low and 2 is the lowest low. Then price fell to the middle of this zone and rebounded, this represents good buying opportunities.
Disclaimer: The content above represents only the views of the author or guest. It does not represent any views or positions of FOLLOWME and does not mean that FOLLOWME agrees with its statement or description, nor does it constitute any investment advice. For all actions taken by visitors based on information provided by the FOLLOWME community, the community does not assume any form of liability unless otherwise expressly promised in writing.
FOLLOWME Trading Community Website: https://www.followme.com


Hot
-THE END-