How to Determine the Support Resistance Level Accurately? 2 Simple & Practical Ways to Share!

Method one: identify the quantity of long and short.
First of all, we need to know how the branch resistance is formed.
It can be transformed between long and short when certain conditions are reached:
In an upward trend, as the increase becoming bigger and bigger, traders will sell their chip when the gains of multiple parties are recognized by a number of people.
At this point, the long-short forces will change, with the previous strong bulls decreasing as the gains increase, while the short will grow as the selling forces increase. The long and short forces will eventually reach a balance, between the ebb and flow, then the trend of the position is what we call the resistance level (as known as support in down trend).
In addition to the mutual conversion between long and short aides, the emergence of reinforcements should also be taken into consideration.
In an upward trend, for example, when the price reaches the previous jailbreak zone, a strong reinforcement will usher in the short side, because there are a large number of locked chips waiting to be liberated, leading to the instant change between the strength of long and short. That is why we generally think of the position of the front high as resistance and front low as support, because this position is generally accompanied with new forces, which will trigger a change in the comparison of long and short power.
As another example, if an upward trend is formed, a lot of over- the -counter funds will be attracted and intervene. At that time, the long side will be stronger, forming an accelerated rise.
Finally, the trend is used to quantify the change in long and short power.
The change of long and short power is invisible and intangible, so we need to quantify the change of them by observing the trend structure.
By observing the trend structure, we can see that the stronger the long side, the larger the rising angle and the greater the rate of rise. Conversely, the stronger the short side, the faster it will decline. There will be a volatile trend when the long and short strengths are similar.
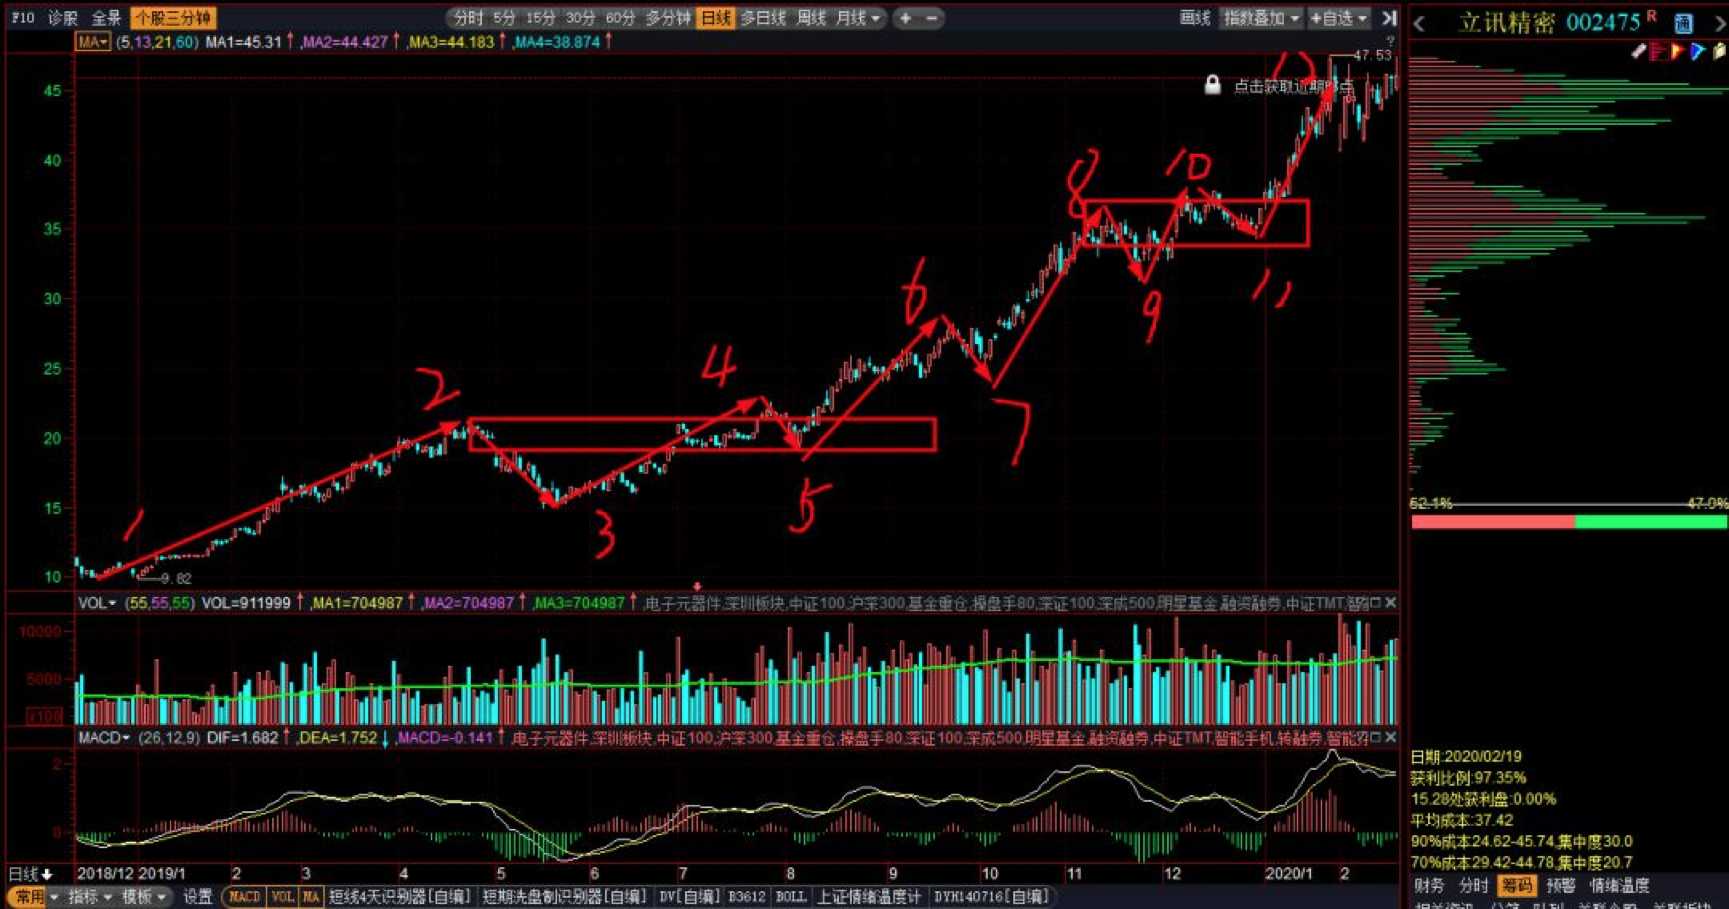
As shown in the figure above, why are points 2, 6, 8, and 12 resistance levels?
First, let’s look at point 2:
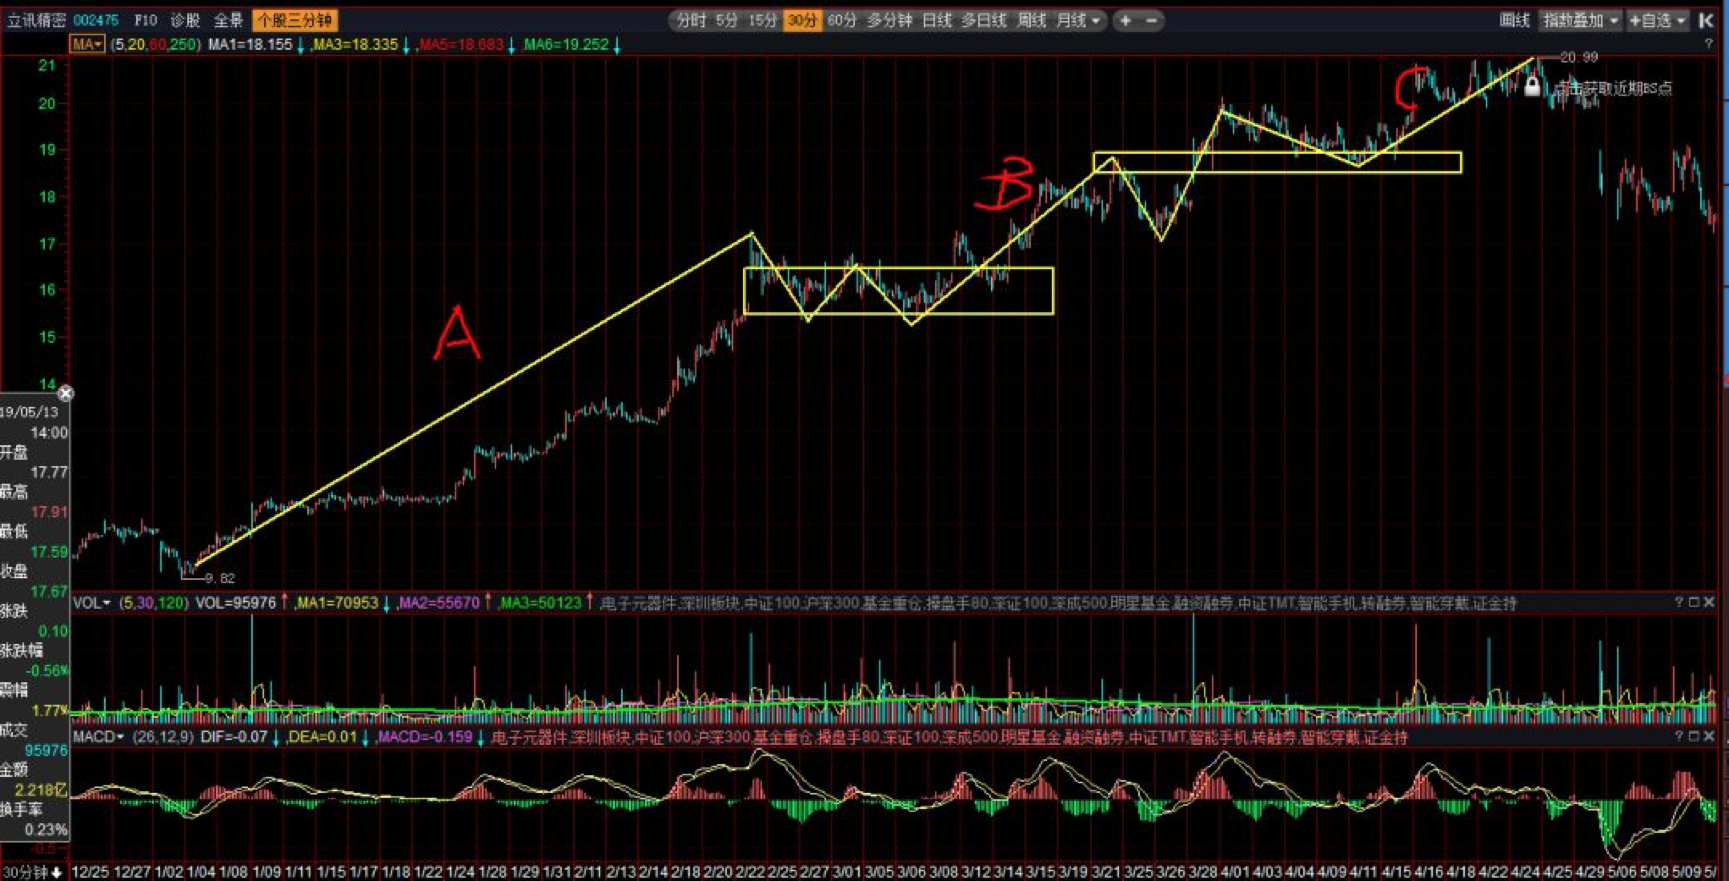
As shown in the above figure, this is the performance of the 12 in the above figure in 60 minutes. The comparison of the three sections A / B / C is obvious. The strength of the rise is weaker and weaker due to the conversion between the long and short sides.
As the growth rate increasing, more and more bulls are converted into bears. Therefore, at this level when the C section comes out, the strength of the long and short sides converses as a result. When the C segment is running, we can make a pre-judgment based on the speed and amplitude of the C segment rise, which is pretty necessary for our operation.
The same is true for points 6 and 8. It can be judged by the sub-level that point 12 is a bit different. Point 6 and 8 are the result of conversion between long and short within this daily upward trend, while point 12 is special.
We can see that compared with the central platform of 8-11, 11-12 is obviously contrary to 58, which is less, no matter the length or the force, and that is to say, the kinetic energy of this upward trend is decreasing resulting from the transformation of long and short power. If there is no accident, there will be an adjustment here, which means that the resistance level is coming.
Method 2: Focus on the confluence area.
Traders can determine the support resistance level by focus on the confluence area:
The price is usually at a very important position, such as the obvious highs and lows, and the dense transaction area, which is also the usual entry position. The price usually has a more obvious reaction around the obvious highs and lows, and near the dense transaction area, with resistance near the resistance position and support near the support position.
In addition to the obvious highs and lows and transaction-intensive areas, the following indicators also increase effectiveness of this confluence factor.
If the moving average group is used as an indicator, the area between the two moving averages can be regarded as a dynamic support resistance area. When this area merges with the obvious high and low points and the transaction-intensive area, a very important position is formed.
Besides, the golden line is often used as a standard for dividing support resistance levels, and selecting suitable confluent areas.
Usually the 50% callback line and the 61.8% callback line in the golden section line are most commonly used. When one of these two lines corresponds to the high and low points or the transaction-intensive area, it is also an extraordinary position.
It is worth noting that the convergence of multiple indicators will increase the effectiveness of the support resistance level at this location. The more categories of convergence, the more effective, and more attention should be paid.
Finally, traders can focus on the performance of the K line or price pattern at this position (the position where the two details merged in the previous).
If the price shows the corresponding standard reversal K line, PinBar, engulfing pattern, twilight star, morning star or other patterns here, then it can be regarded as a confirmation signal, indicating that the price is obviously influenced here by support or resistance.
Meanwhile, you can also reduce the period, such as a 4-hour period to a 15min or 30min one. If the price shows an obvious pattern in this confluent area, it can also be used as a message to confirm whether the position of this area is valid.
Disclaimer: The content above represents only the views of the author or guest. It does not represent any views or positions of FOLLOWME and does not mean that FOLLOWME agrees with its statement or description, nor does it constitute any investment advice. For all actions taken by visitors based on information provided by the FOLLOWME community, the community does not assume any form of liability unless otherwise expressly promised in writing.
FOLLOWME Trading Community Website: https://www.followme.com


Hot
-THE END-